USD/JPY Price Analysis: Break of a rising wedge to exacerbate a drop to 138.00
- US Dollar remains offered across the board against most G8 currencies.
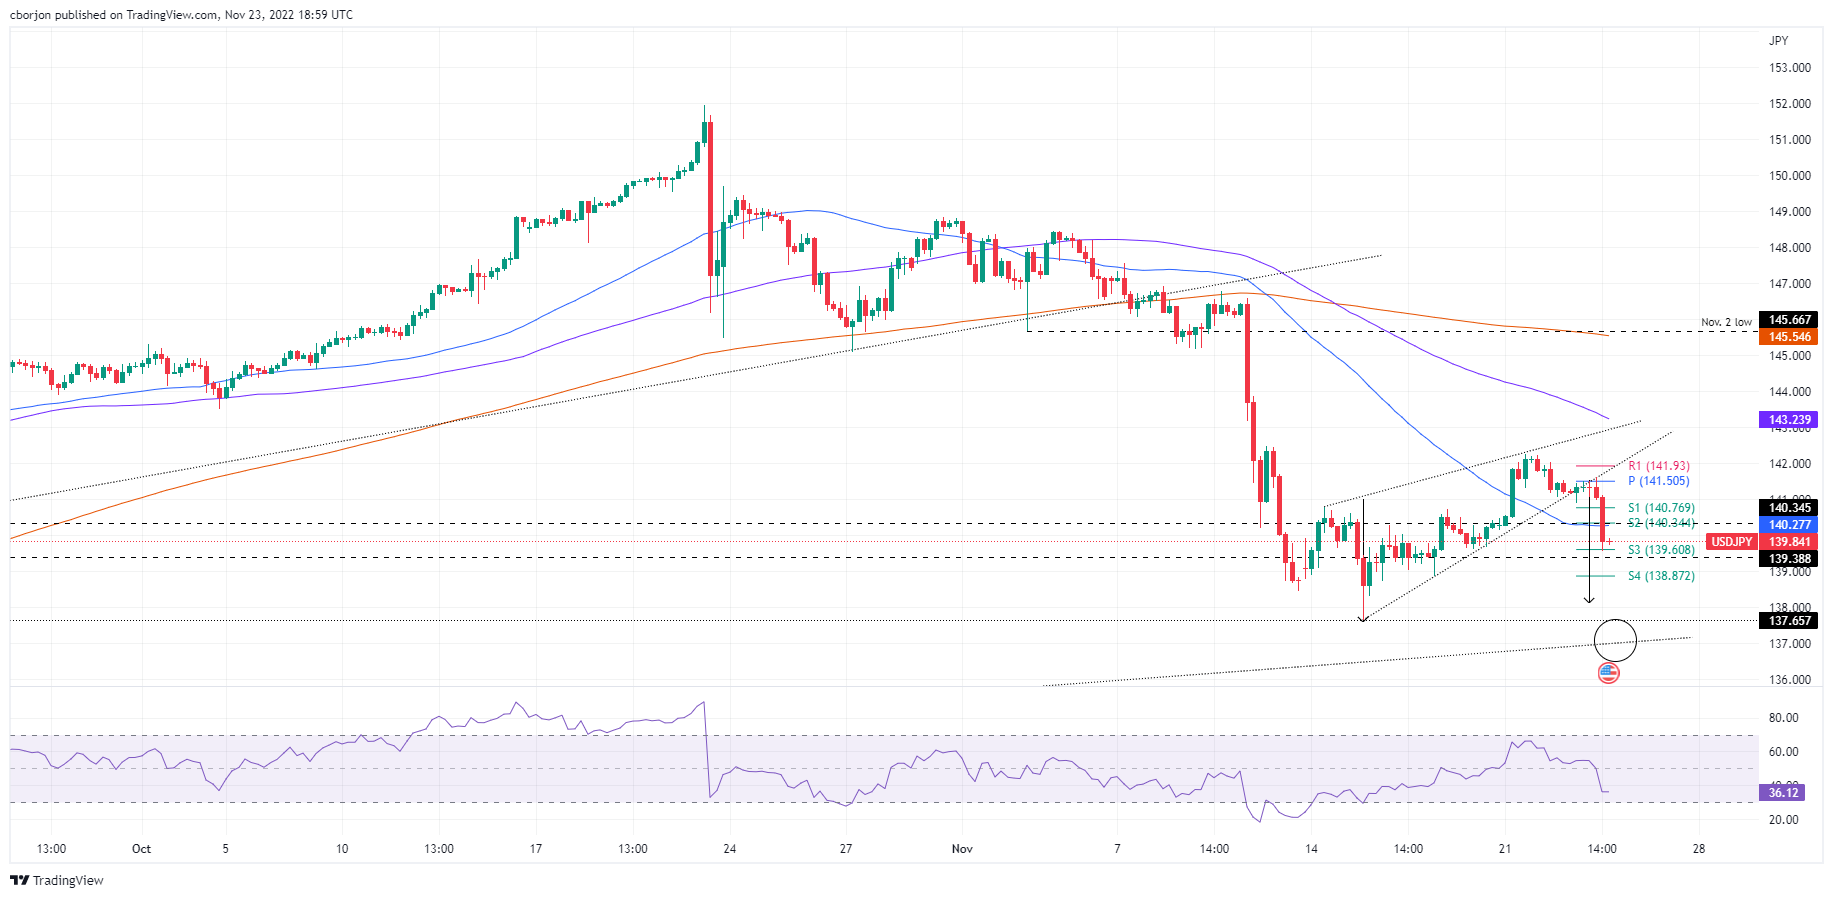
- A broken rising wedge in the USD/JPY 4-hour chart targets a fall towards 138.00.
The USD/JPY prolonged its losses to two consecutive days and cleared the 100-day Exponential Moving Average (EMA), cementing the case of the USD/JPY bias turning neutral-to-downwards, albeit remained trading above the 200-day EMA. Hence, the USD/JPY is trading at 139.83, below its opening price by 0.96%.
USD/JPY Price Analysis: Technical outlook
Once the USD/JPY dropped below the 100-day EMA, the bias shifted neutral downwards, though it should be noted that crucial support levels lie below the spot price. If Japanese Yen (JPY) buyers would like to extend their gains, they need to clear the three-month low of 137.65, which would exacerbate a fall toward a six-month-old upslope support trendline of around 136.70.
Short term, the USD/JPY 4-hour chart broke a rising wedge, a continuation pattern formed after a first leg-down. That said, the USD/JPY is comfortably trading around the S3 daily pivot. Therefore, the USD/JPY first support would be the 139.00 psychological level, followed by the S4 daily pivot level at 138.87, ahead of the November 15 low at 137.65.
USD/JPY Key Technical Levels