Back
11 Sep 2018
GBP/USD Technical Analysis: double curveball on Brexit headlines
- EU negotiators indicating that a workable Brexit plan could materialize in "6 to 8 weeks", while Eurosceptic Tories saw their latest plan to present their own Brexit plan fell apart, prompting a second Brexit hope rally in two weeks.
- Sterling traders should watch out for an overextended bull run which could prompt sellers to step back in.
- UK earnings report due today could also be a wrench in the works, while a positive reading could easily see an extension.
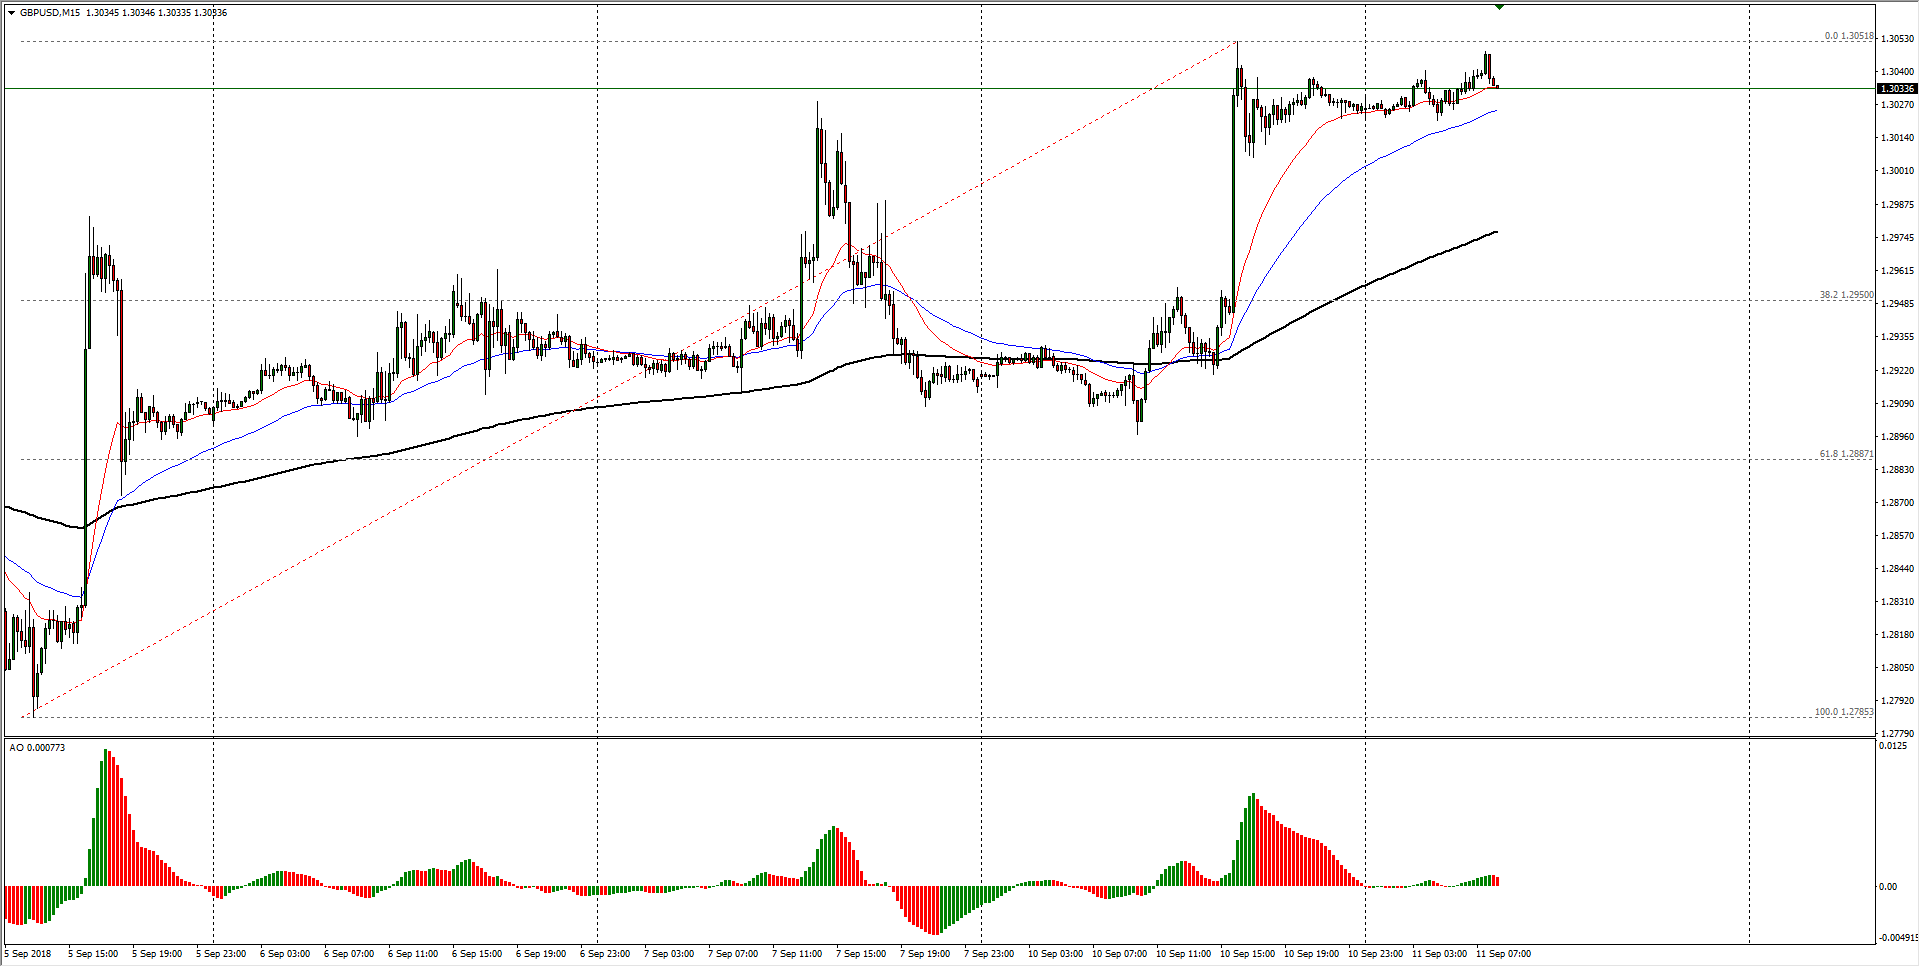
GBP/USD Chart, 15-Minute

| Spot rate: | 1.3033 |
| Relative change: | 0.06% |
| High: | 1.3048 |
| Low: | 1.3020 |
| Trend: | Bullish |
| Support 1: | 1.2950 (38.2% Fibo retracement) |
| Support 2: | 1.2898 (current week low) |
| Support 3: | 1.2785 (previous week low) |
| Resistance 1: | 1.3050 (major technical barrier, current week high) |
| Resistance 2: | 1.3213 (July 26th swing high) |
| Resistance 3: | 1.3305 (200-day EMA) |
