USD/JPY Technical Analysis: Greenback losing steam as bears target 113.00 figure
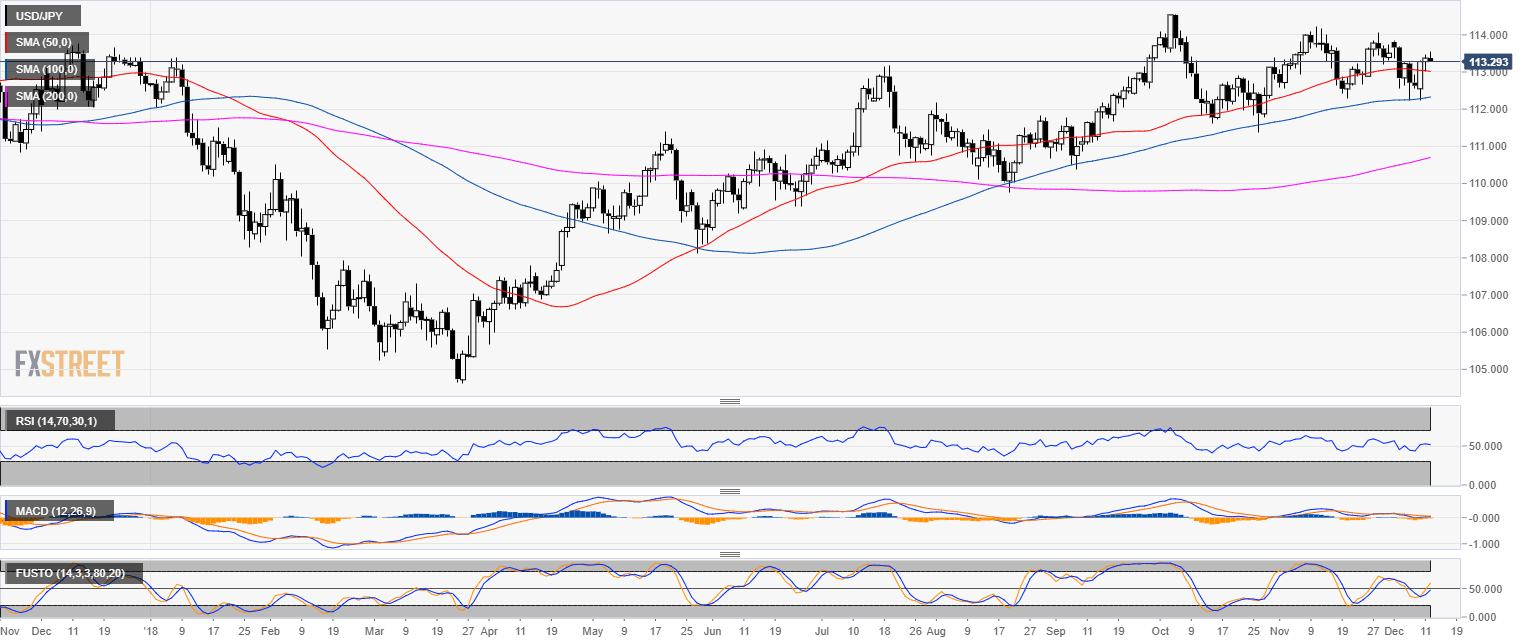
USD/JPY daily chart
- USD/JPY is trading in a bull trend above the 50, 100 and 200-day simple moving average (SMA).
- The Core US Consumer Price Index y/y for November came in at 2.2% in line with analysts forecast.
USD/JPY 4-hour chart
- USD/JPY is finding some resistance near the 113.40 resistance.

USD/JPY 30-minute chart
- USD/JPY is decelerating below the 113.40 resistance suggesting a pullback down to 113.00 figure.

Additional key levels
USD/JPY
Overview:
Today Last Price: 113.3
Today Daily change: -7.0 pips
Today Daily change %: -0.0617%
Today Daily Open: 113.37
Trends:
Previous Daily SMA20: 113.18
Previous Daily SMA50: 113.04
Previous Daily SMA100: 112.3
Previous Daily SMA200: 110.65
Levels:
Previous Daily High: 113.48
Previous Daily Low: 112.98
Previous Weekly High: 113.83
Previous Weekly Low: 112.23
Previous Monthly High: 114.25
Previous Monthly Low: 112.3
Previous Daily Fibonacci 38.2%: 113.28
Previous Daily Fibonacci 61.8%: 113.17
Previous Daily Pivot Point S1: 113.07
Previous Daily Pivot Point S2: 112.77
Previous Daily Pivot Point S3: 112.57
Previous Daily Pivot Point R1: 113.57
Previous Daily Pivot Point R2: 113.77
Previous Daily Pivot Point R3: 114.07