EUR/GBP Technical Analysis: Euro bulls recapture the 0.8800 figure
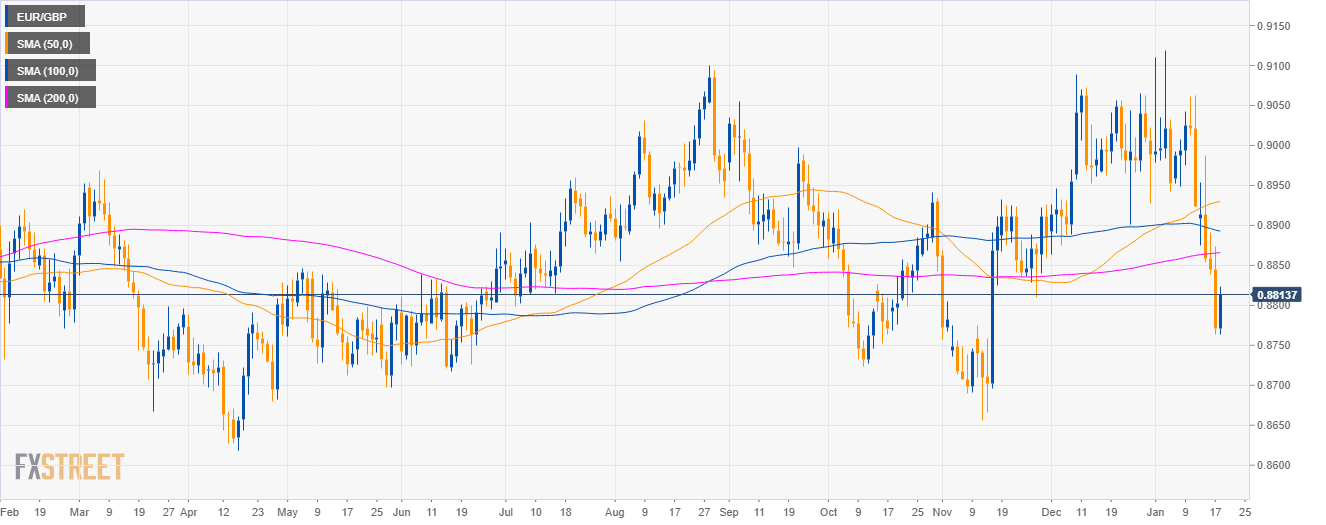
EUR/GBP daily chart
- EUR/GBP is trading in a sideways trend below the 50, 100 and 200-day simple moving averages (SMAs).

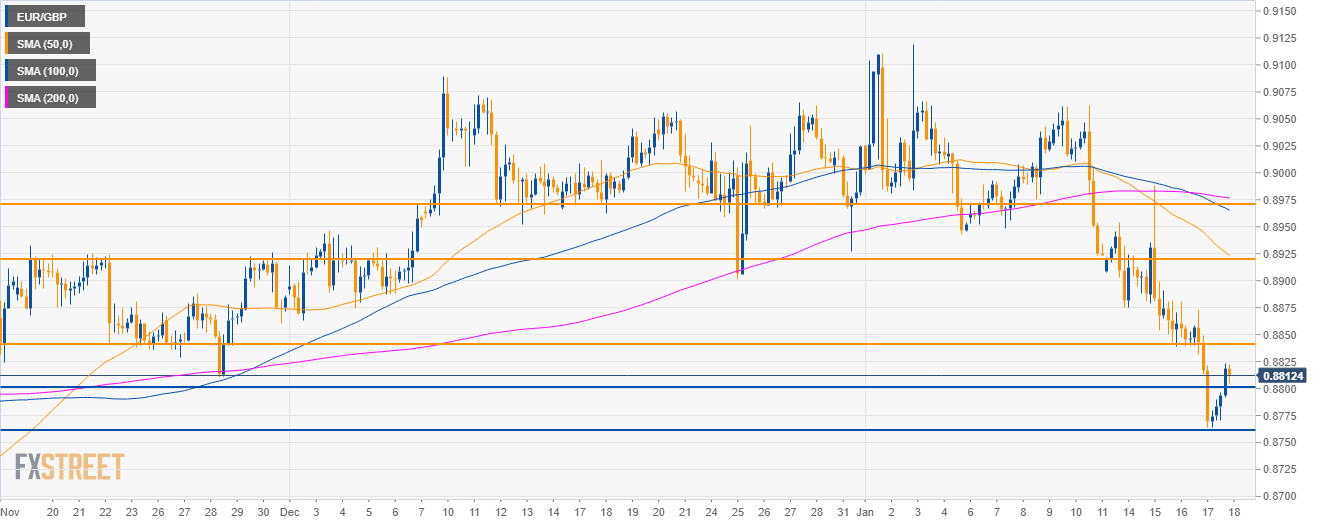
EUR/GBP 4-hour chart
- EUR/GBP is trading below its main SMAs as bulls recapture the 0.8800 figure.

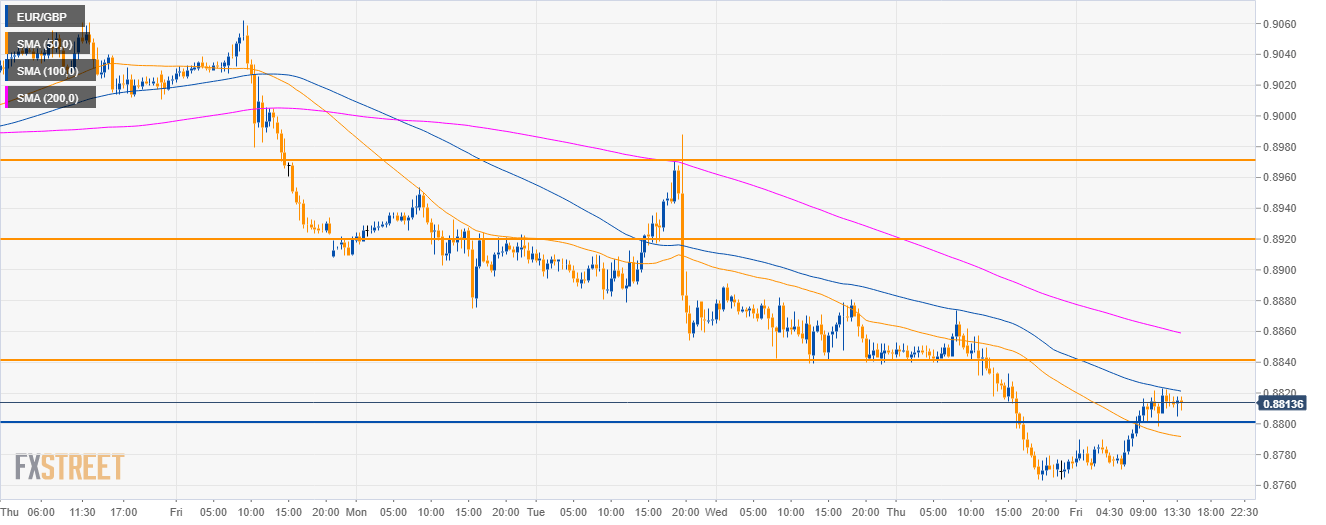
EUR/GBP 30-minute chart
- As bulls regained the 50 SMA the next target is likely near the 0.8840 resistance.
- Support is seen at the 0.8760 level.

Additional key levels
EUR/GBP
Overview:
Today Last Price: 0.8811
Today Daily change: 40 pips
Today Daily change %: 0.468%
Today Daily Open: 0.877
Trends:
Daily SMA20: 0.8965
Daily SMA50: 0.8929
Daily SMA100: 0.8894
Daily SMA200: 0.8865
Levels:
Previous Daily High: 0.8874
Previous Daily Low: 0.8764
Previous Weekly High: 0.9062
Previous Weekly Low: 0.8923
Previous Monthly High: 0.9089
Previous Monthly Low: 0.8863
Daily Fibonacci 38.2%: 0.8806
Daily Fibonacci 61.8%: 0.8831
Daily Pivot Point S1: 0.8732
Daily Pivot Point S2: 0.8692
Daily Pivot Point S3: 0.8622
Daily Pivot Point R1: 0.8842
Daily Pivot Point R2: 0.8913
Daily Pivot Point R3: 0.8952
