EUR/USD Technical Analysis: Slow bearish grind below 1.1400 figure in the New York session
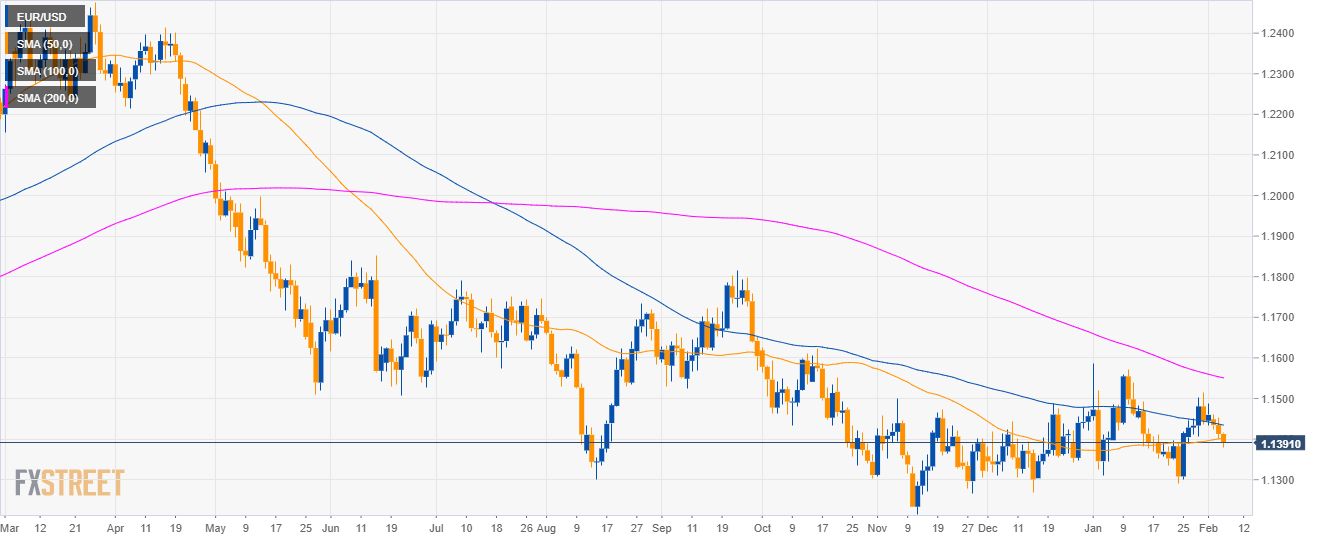
EUR/USD daily chart
- EUR/USD is trading in a bear trend below the 200-day simple moving average (SMA).
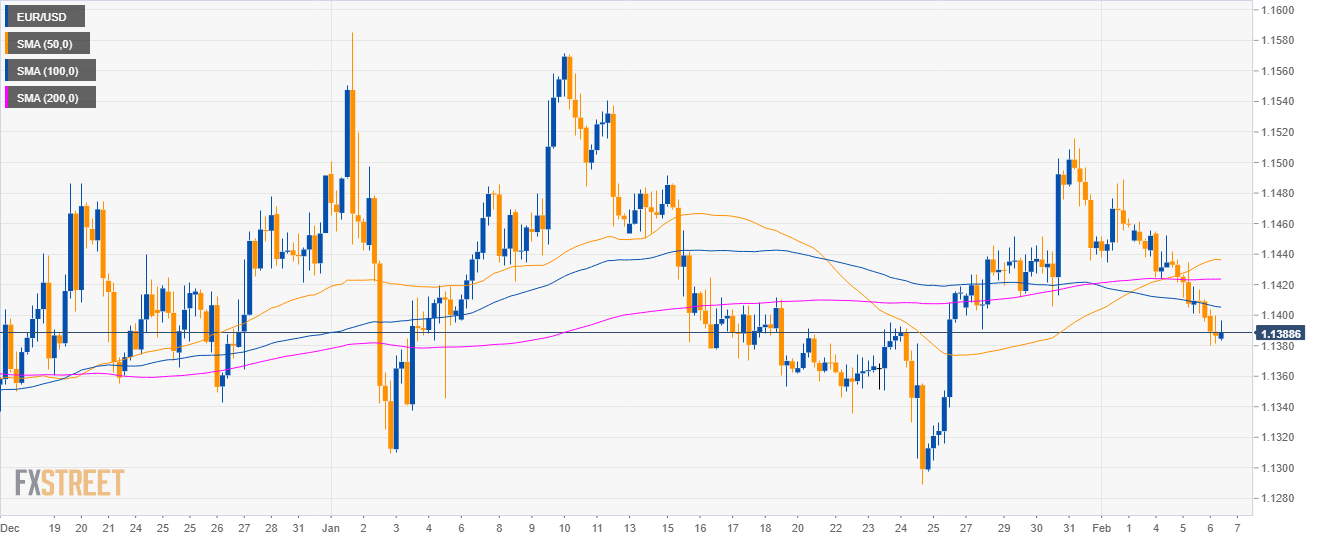
EUR/USD 4-hour chart
- EUR/USD is trading just below the 1.1400 figure and its main SMAs.
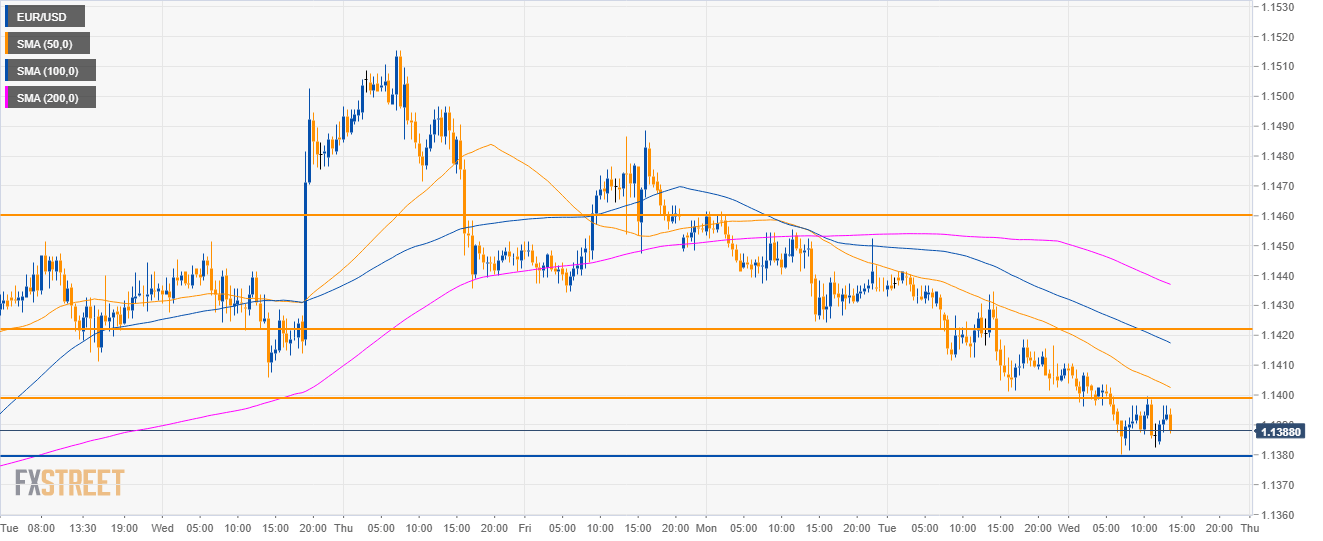
EUR/USD 30-minute chart
- EUR/USD is trading below its main SMAs suggesting bearish momentum.
- A bearish break below 1.1380 would open the doors to the 1.1320 level.
- On the flip side, bulls need to initially regain the 1.1400 figure followed by 1.1420 and 1.1460 level.
Additional key levels
EUR/USD
Overview:
Today Last Price: 1.1391
Today Daily change: -22 pips
Today Daily change %: -0.19%
Today Daily Open: 1.1413
Trends:
Daily SMA20: 1.1423
Daily SMA50: 1.1401
Daily SMA100: 1.1437
Daily SMA200: 1.1554
Levels:
Previous Daily High: 1.1453
Previous Daily Low: 1.1401
Previous Weekly High: 1.1516
Previous Weekly Low: 1.139
Previous Monthly High: 1.1586
Previous Monthly Low: 1.1289
Daily Fibonacci 38.2%: 1.1421
Daily Fibonacci 61.8%: 1.1433
Daily Pivot Point S1: 1.1392
Daily Pivot Point S2: 1.1371
Daily Pivot Point S3: 1.1341
Daily Pivot Point R1: 1.1443
Daily Pivot Point R2: 1.1473
Daily Pivot Point R3: 1.1494