EUR/USD Technical Analysis: Fiber at daily highs challenging the 1.1300 figure
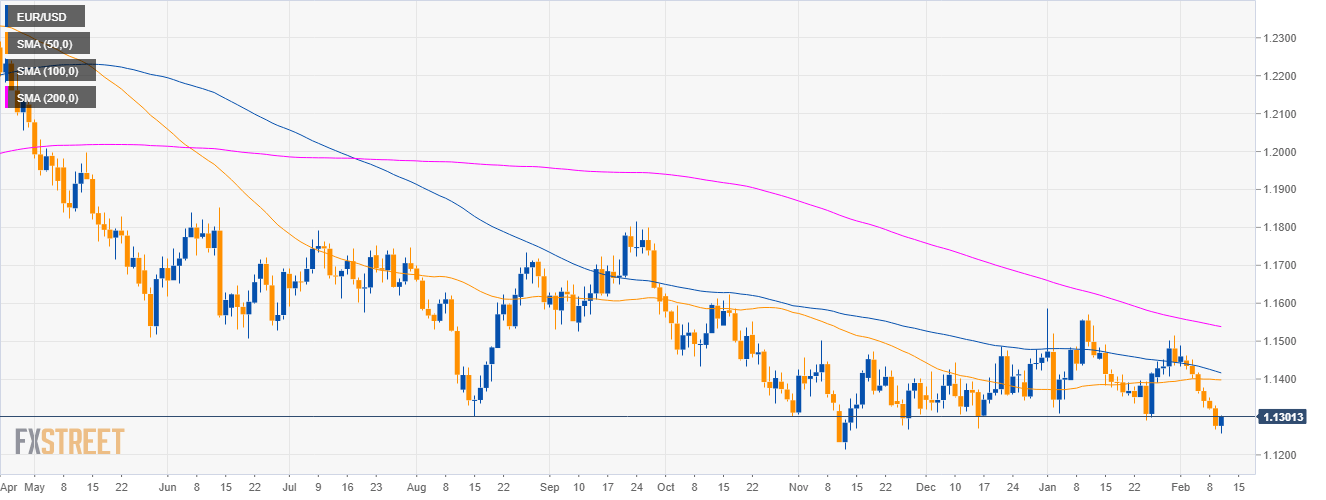
EUR/USD daily chart
- EUR/USD is trading in a bear trend below the 200-day simple moving average (SMA).
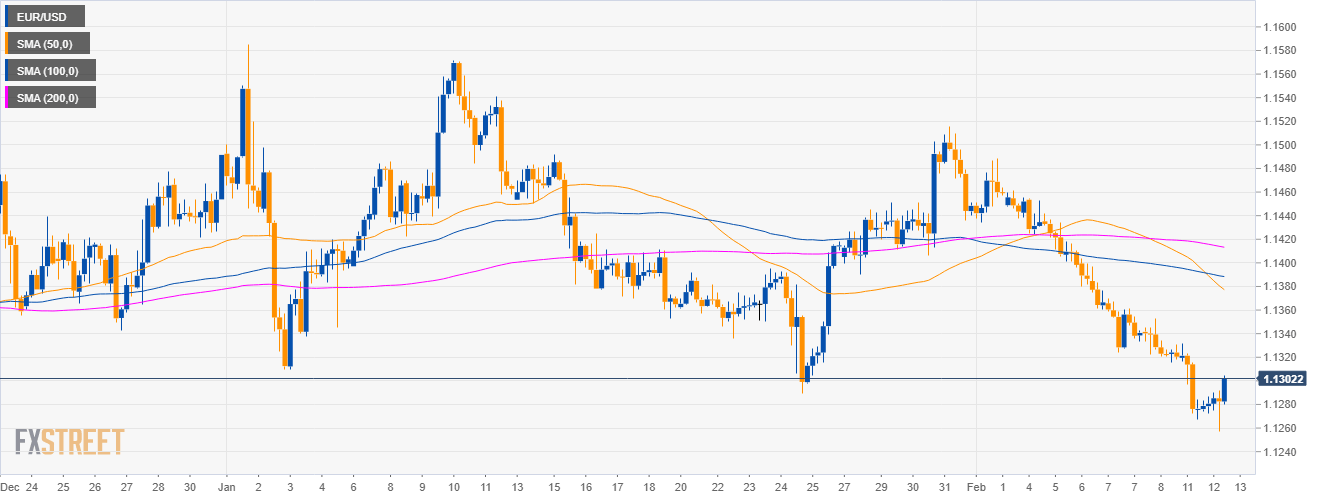
EUR/USD 4-hour chart
- EUR/USD is trading below its main SMAs suggesting bearish momentum in the medium-term.
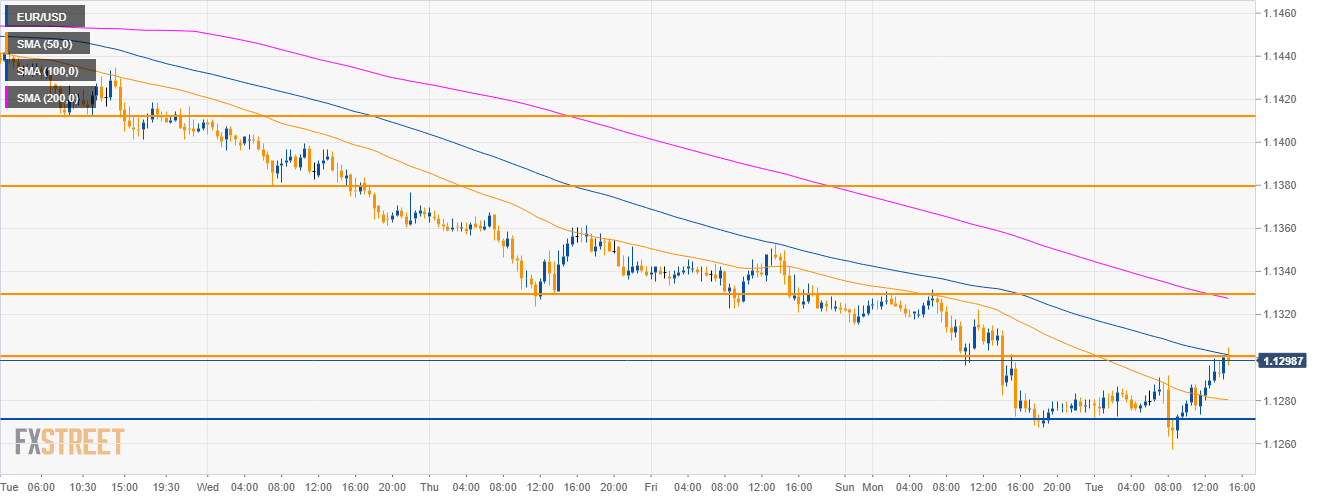
EUR/USD 30-minute chart
- EUR/USD is trading below its 100 and 200 SMA suggesting bearish momentum in the short-term.
- If bears prevent an advance beyond 1.1300 they can expect a revisit of 1.1270 to the downside.
- On the flip side, in the short-term, bulls might breach 1.1300 figure and the 50 SMA to drive the market to the 1.1330 level.
Additional key levels
EUR/USD
Overview:
Today Last Price: 1.13
Today Daily change: 24 pips
Today Daily change %: 0.21%
Today Daily Open: 1.1276
Trends:
Daily SMA20: 1.139
Daily SMA50: 1.1398
Daily SMA100: 1.1421
Daily SMA200: 1.1541
Levels:
Previous Daily High: 1.1332
Previous Daily Low: 1.1267
Previous Weekly High: 1.1462
Previous Weekly Low: 1.132
Previous Monthly High: 1.1586
Previous Monthly Low: 1.1289
Daily Fibonacci 38.2%: 1.1292
Daily Fibonacci 61.8%: 1.1307
Daily Pivot Point S1: 1.1252
Daily Pivot Point S2: 1.1228
Daily Pivot Point S3: 1.1188
Daily Pivot Point R1: 1.1316
Daily Pivot Point R2: 1.1356
Daily Pivot Point R3: 1.138