Back


14 Oct 2019
US Dollar Index technical analysis: DXY ends Monday in positive territories near 98.50 level
- DXY starts the week with a gap up but remains under bearish pressure.
- The level to beat for bulls is the 98.63 resistance.
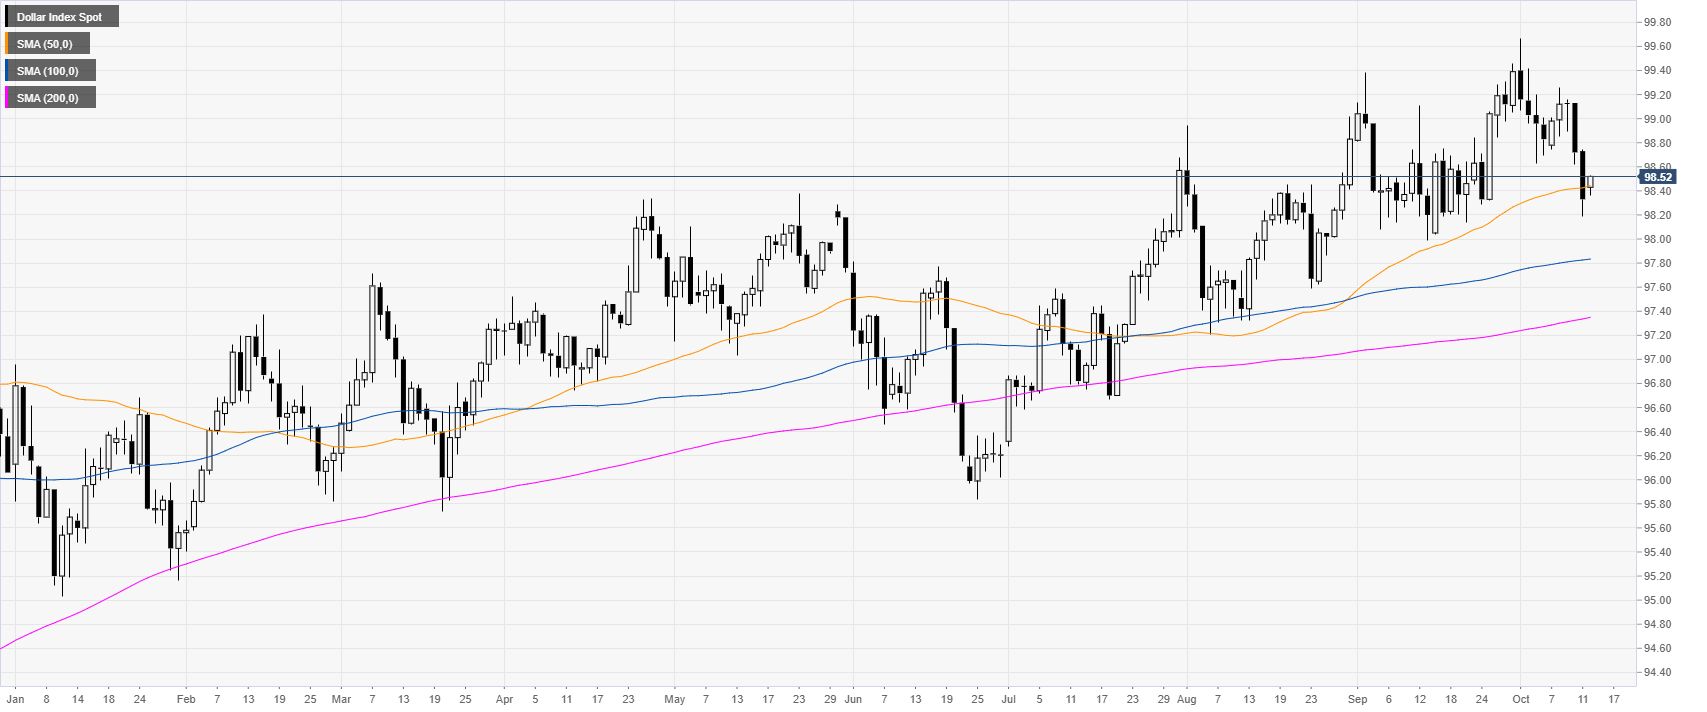
DXY daily chart
The US Dollar Index (DXY) is trading in a bull trend above its main simple moving averages (DSMAs). This Monday DXY consolidated above the 50 SMA the decline seen last Friday.
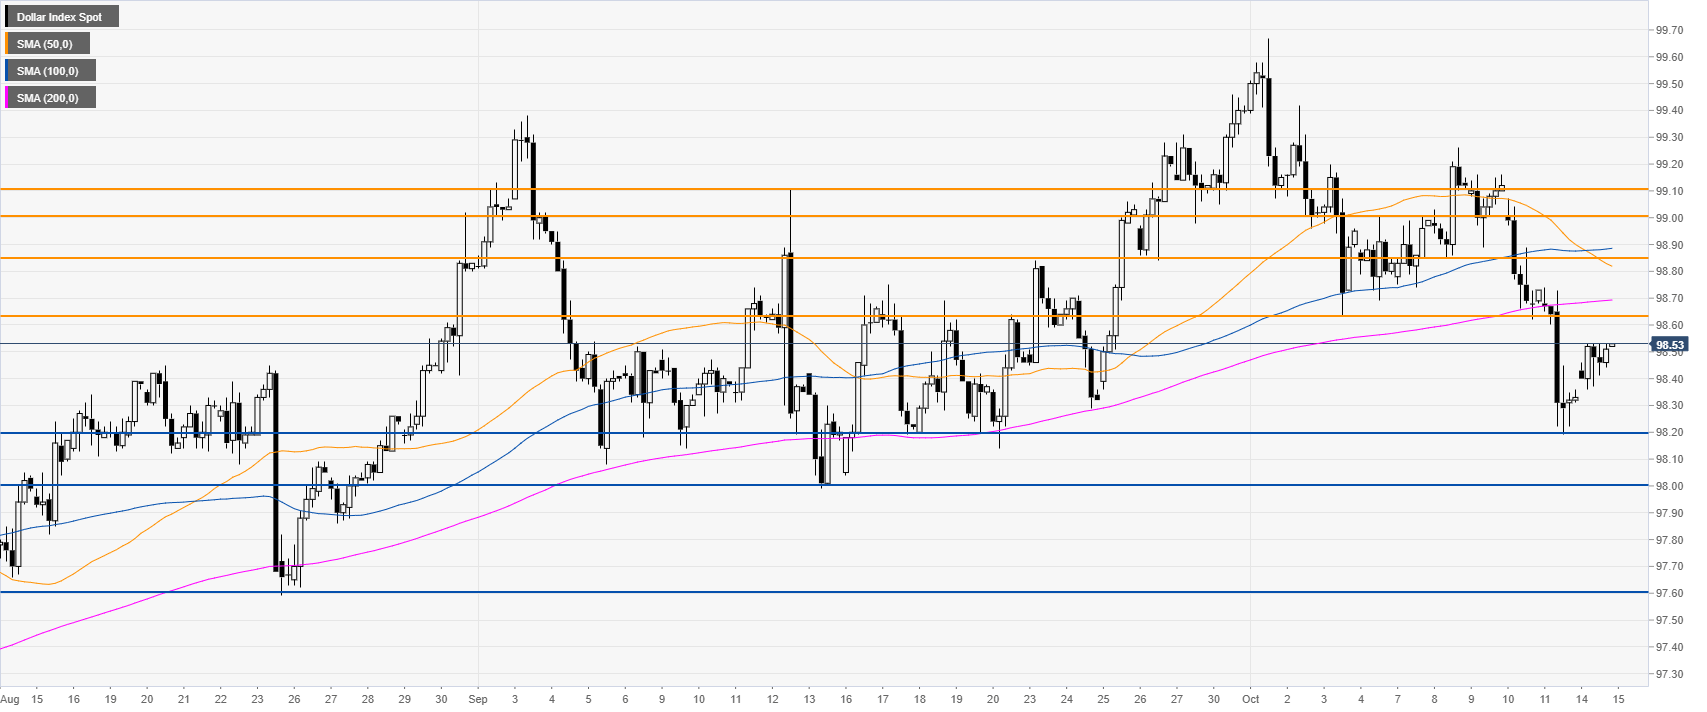
DXY four-hour chart
DXY started the week with a gap up while still trading below its main SMAs, suggesting a bearish bias in the medium term. Bears need a break below the 98.20/98.00 support zone to target the 97.60 price level on the way down.

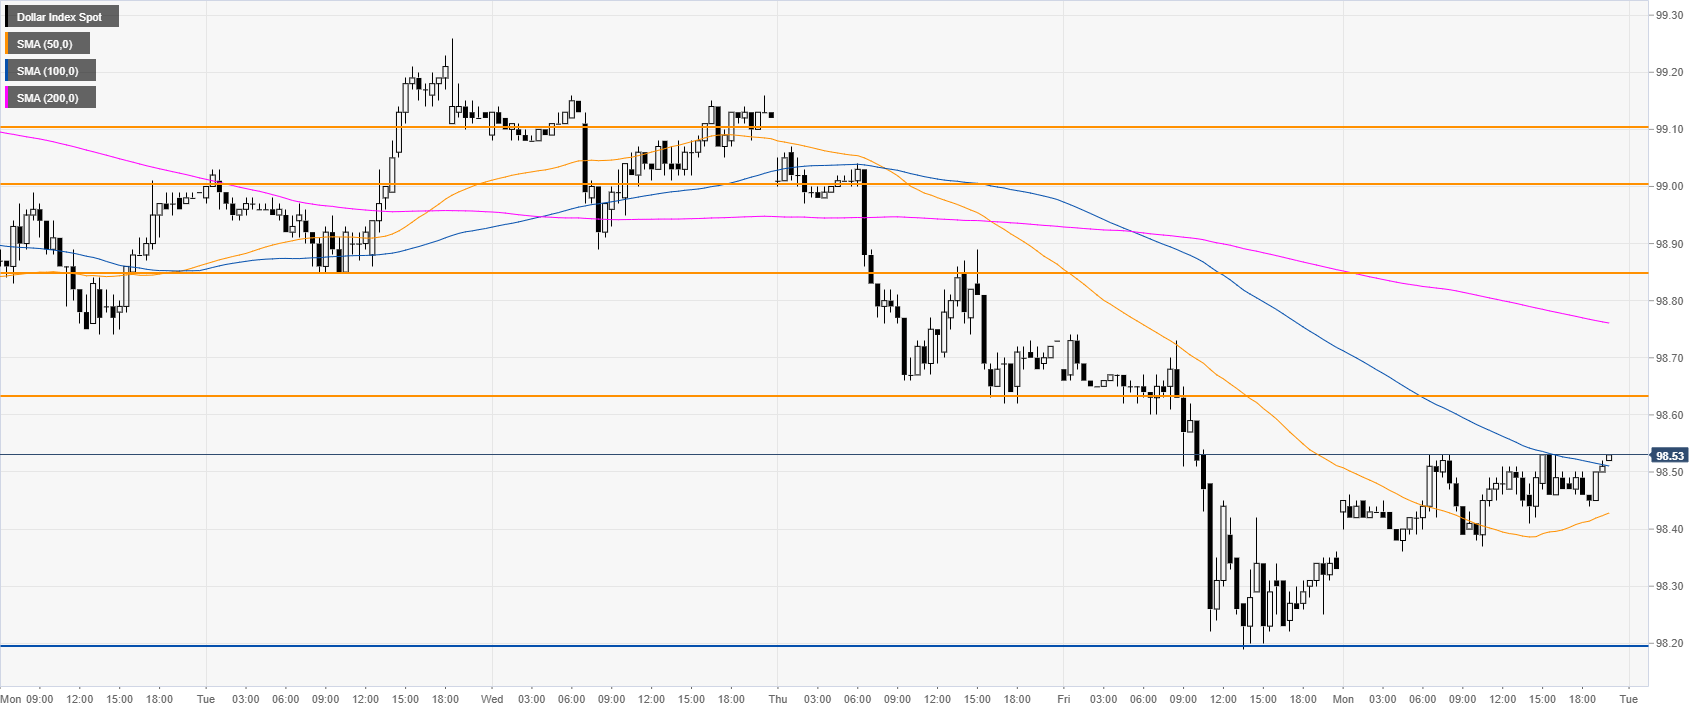
DXY 30-minute chart
DXY is consolidating between the 50 and 200 SMAs, suggesting a sideways market in the near term. Bulls would need to have a daily close above the 98.63 resistance to target the 98.85 and 99.00 resistances.

Additional key levels

