Back
31 Oct 2019
EUR/USD technical analysis: Euro approaching the October highs post-Fed
- The Euro is nearing monthly highs after the Fed cut interest rates.
- The level to beat for buyers is the 1.1165 resistance.
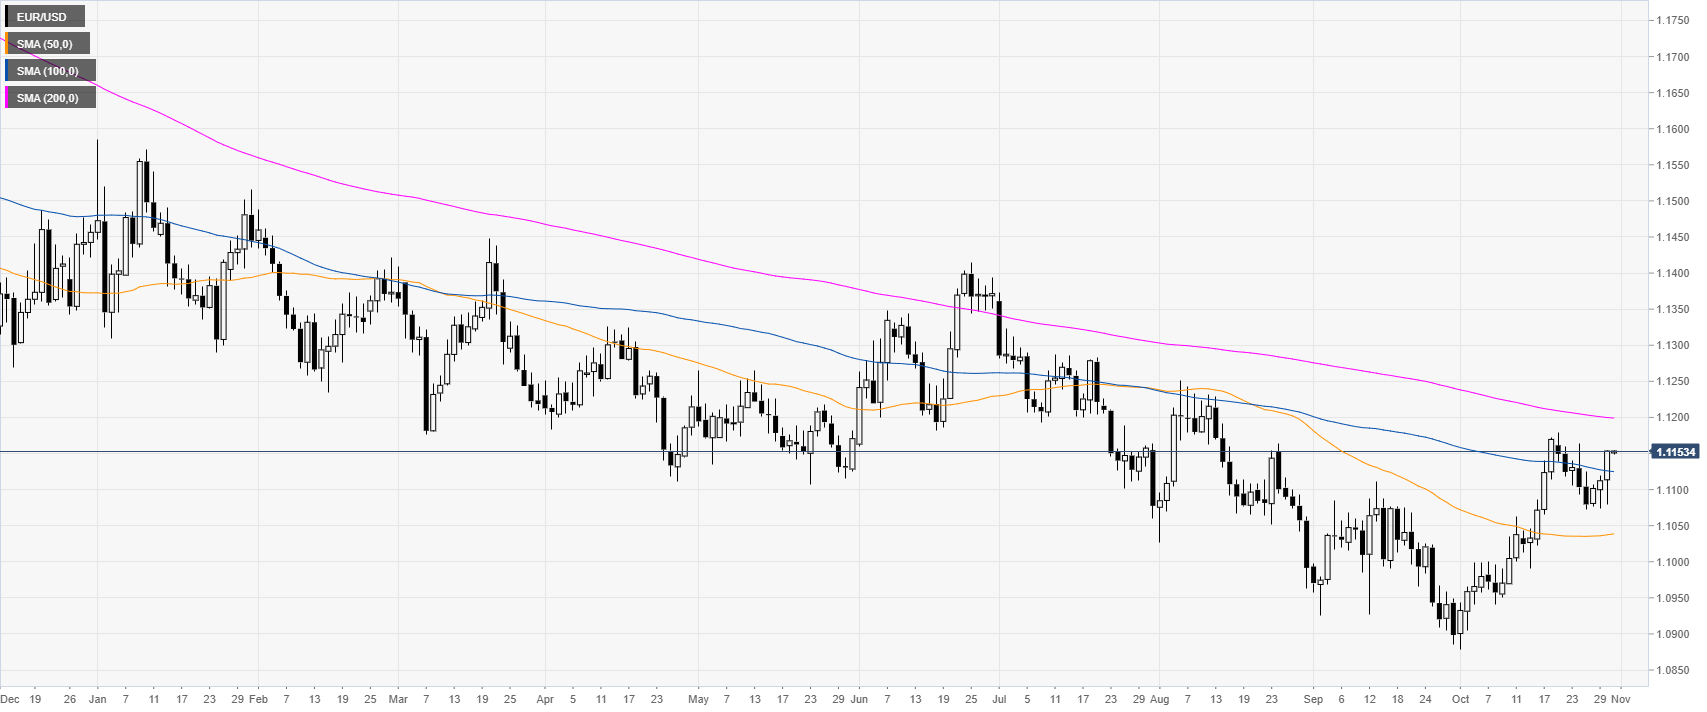
EUR/USD daily chart
On the daily chart, the Fiber is trading in a bear trend below its 200-day simple moving average (DMAs). The Fed cut interest rates by 25 bps as widely expected, but Fed’s Chair Powell failed to impress the market during its speech sending USD down and EUR/USD up.
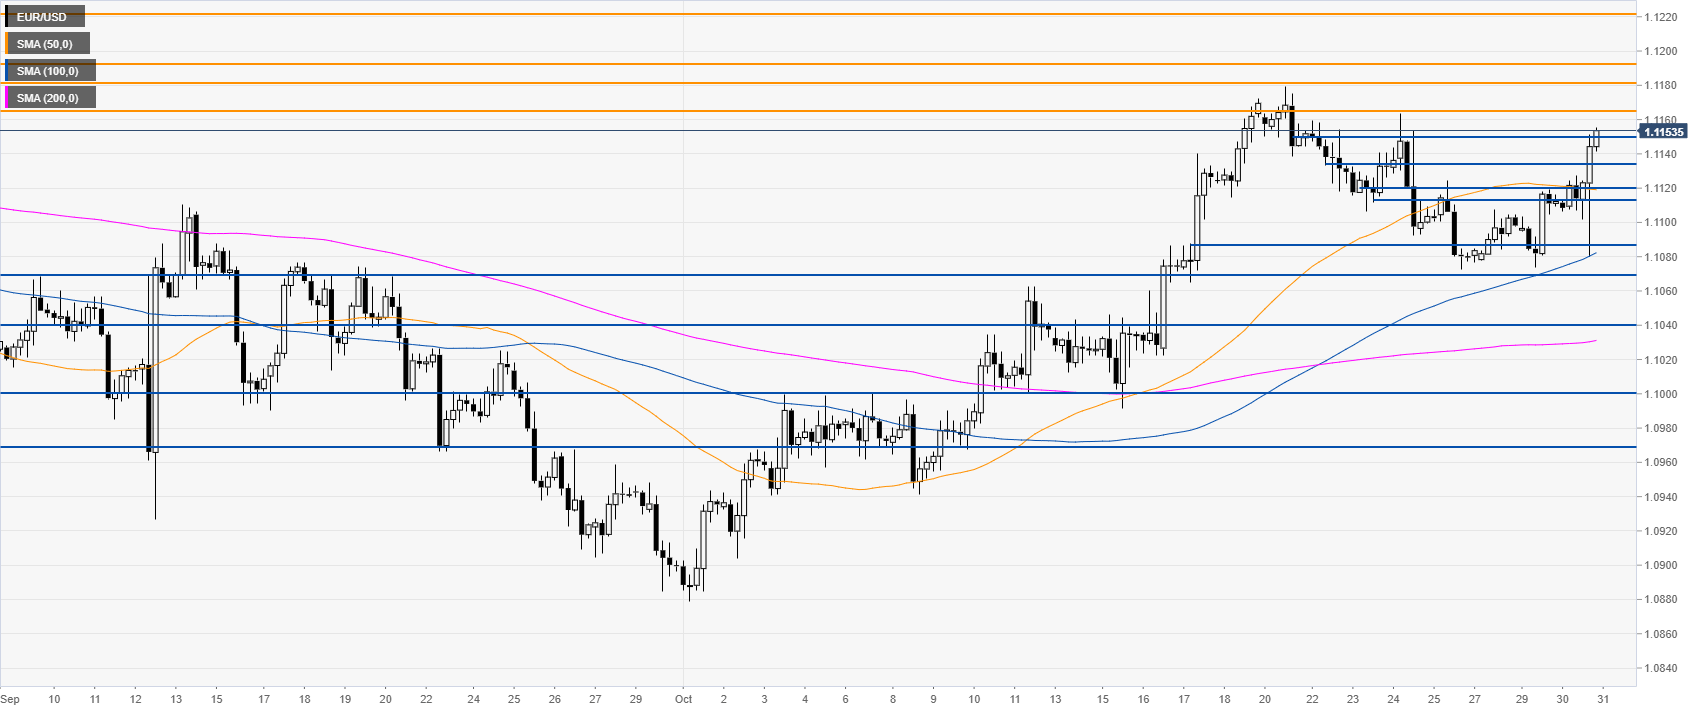
EUR/USD four-hour chart
The Fiber, on the four-hour chart, is trading above its main SMAs as it is nearing the October highs.The market broke above the 1.1150 resistance. The level to beat for buyers is now 1.1165 resistance. A break above it can lead the spot to 1.1181/1.1193, 1.1220, according to the Technical Confluences Indicator.
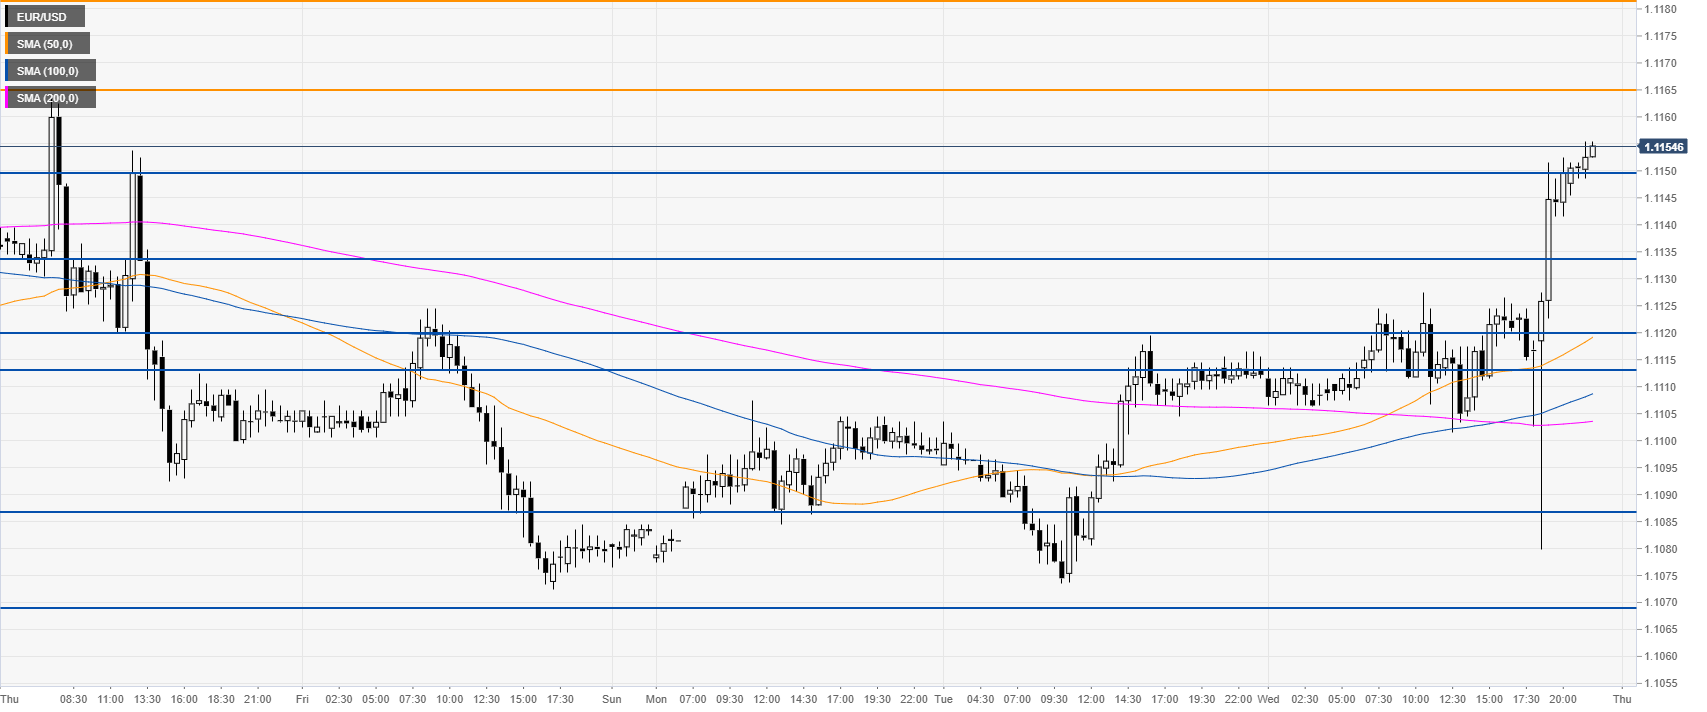
EUR/USD 30-minute chart
EUR/USD is trading above the main SMAs on the 30-minute chart, suggesting a bullish bias in the near term. Support is seen at the 1.1150, 1.1133 and 1.1113/20 price level.
Additional key levels