EUR/USD technical analysis: Monthly trendline probes pullback from 1.1180
- EUR/USD forms an ascending triangle below 200-day SMA.
- Bullish MACD doubts pair’s further declines, 61.8% Fibonacci retracement adds to the resistance.
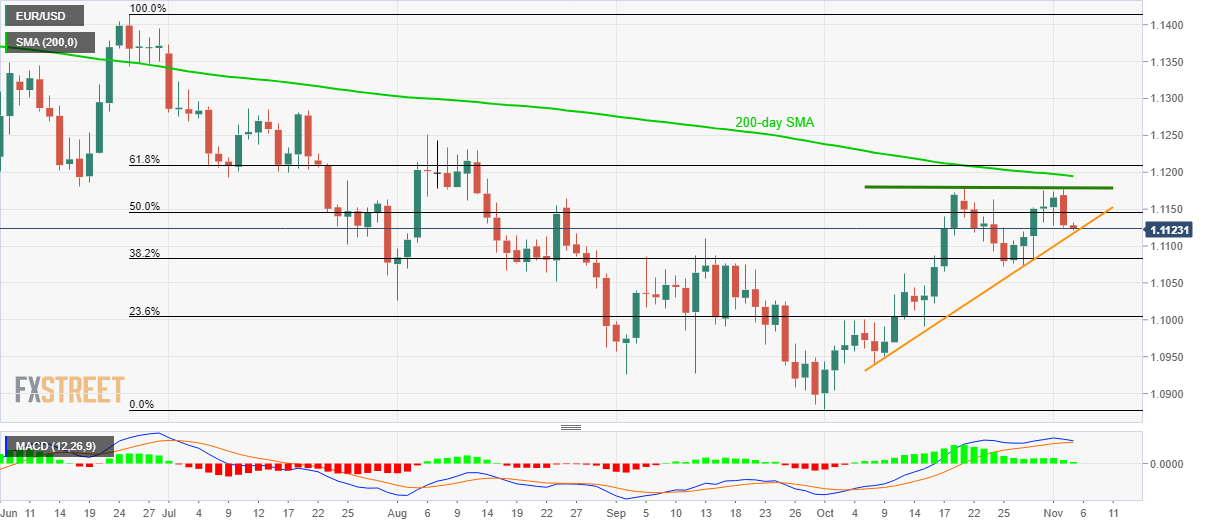
Following pair’s pullback from October month high, EUR/USD declines to an upward sloping trend line since early previous month while trading near 1.1123 during the initial Tuesday.
Considering the aforementioned monthly support line and a horizontal area around 1.1180, including October high, together form an ascending triangle. However, the bullish signal from 21-bar Moving Average Convergence and Divergence (MACD) contradicts the bearish technical formation.
That said, sellers will look for entry below the support-line of the pattern, around 1.1115, to target October 25 low near 1.1072 and 23.6% Fibonacci retracement level of June-October downpour, close to 1.1000 mark.
If prices slip below 1.1000, 1.0925 will be a halt before pleasing sellers with 1.0880 rest-point.
On the contrary, pair’s rise above 1.1180 will confront a 200-day Simple Moving Average (SMA) level of 1.1195 and 61.8% Fibonacci retracement, at 1.1210, prior to extending the recovery towards August month top surrounding 1.1250.
EUR/USD daily chart

Trend: sideways
