Back


5 Dec 2019
AUD/USD price analysis: Australian dollar trading in a triangle pattern near 0.6830 level
- The aussie is off daily lows after being under relative bearish pressure earlier in the session.
- The level to beat for sellers is the 0.6821/14 support zone.
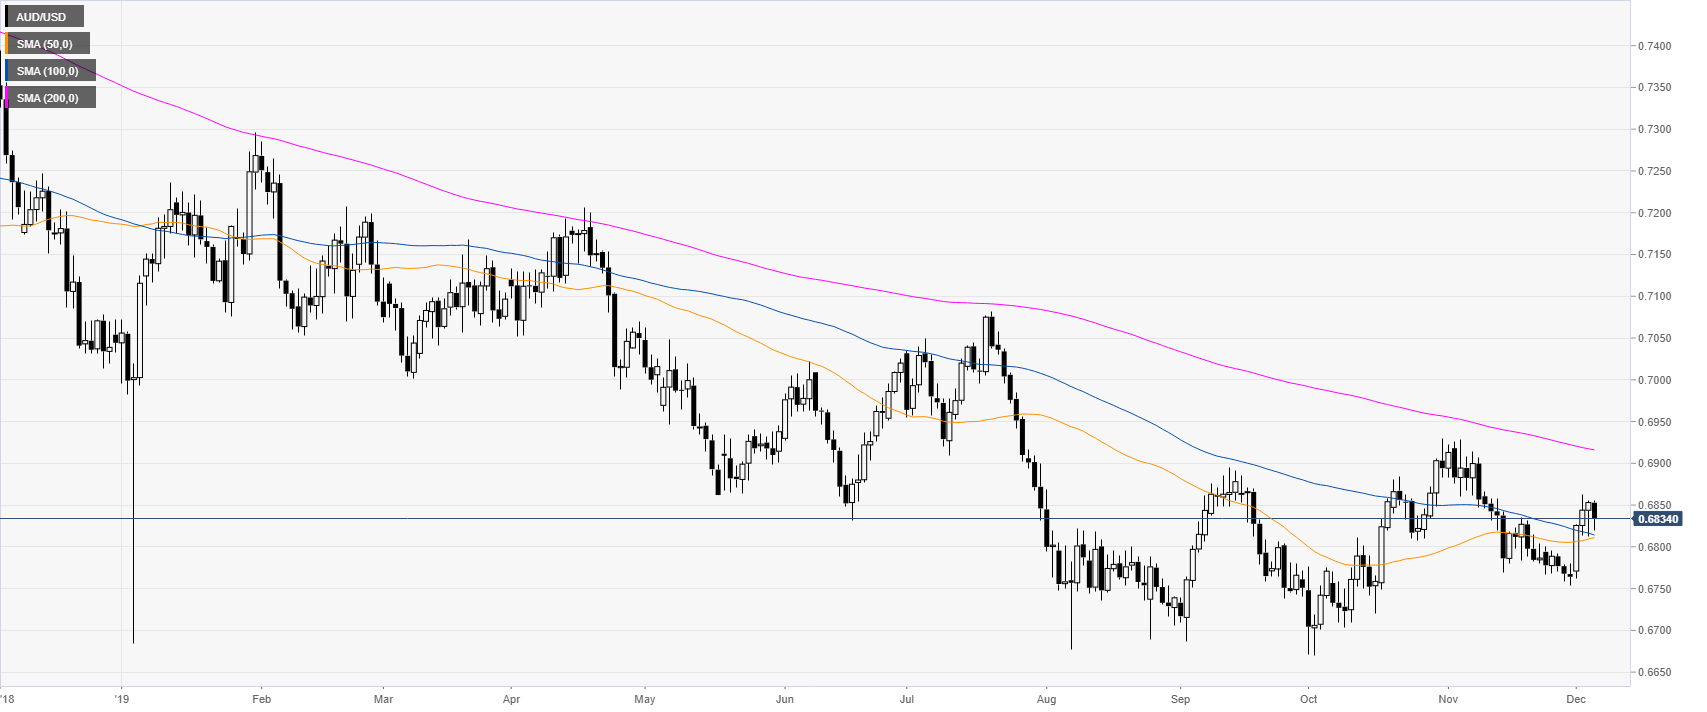
AUD/USD daily chart
AUD/USD is trading in a downtrend below its 200-day simple moving average (DMA). However, the spot had a bounce near the 0.6850 level above the 50 and 100 DMAs.

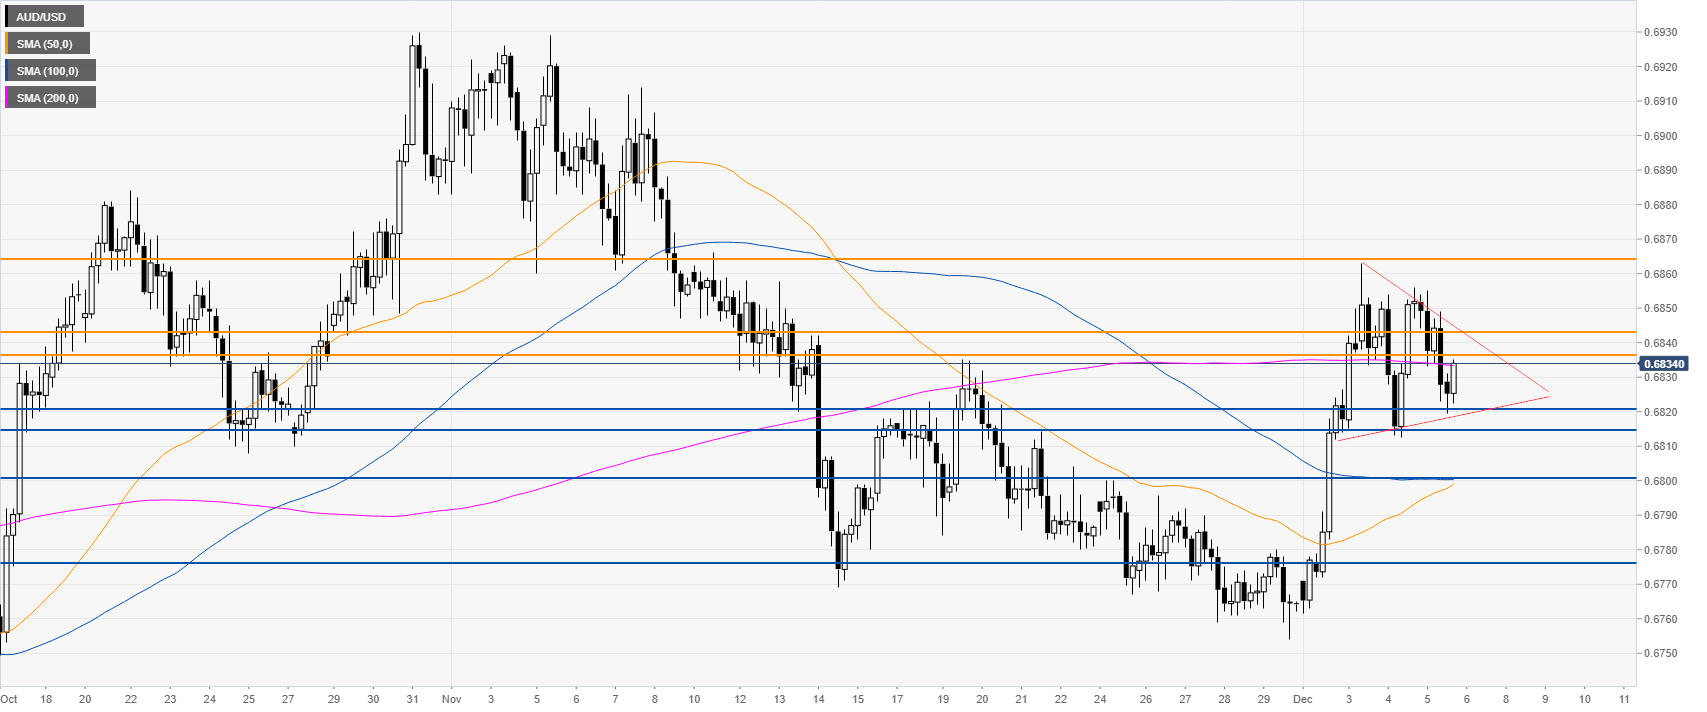
AUD/USD four-hour chart
The aussie is consolidating the recent gains in a triangle pattern around the 200 SMA. In the New York session, the market is trading below the 0.6836/43 resistance zone. However, if the market happens to pierce this zone, the quote could climb to the 0.6864 level, according to the Technical Confluences Indicator.

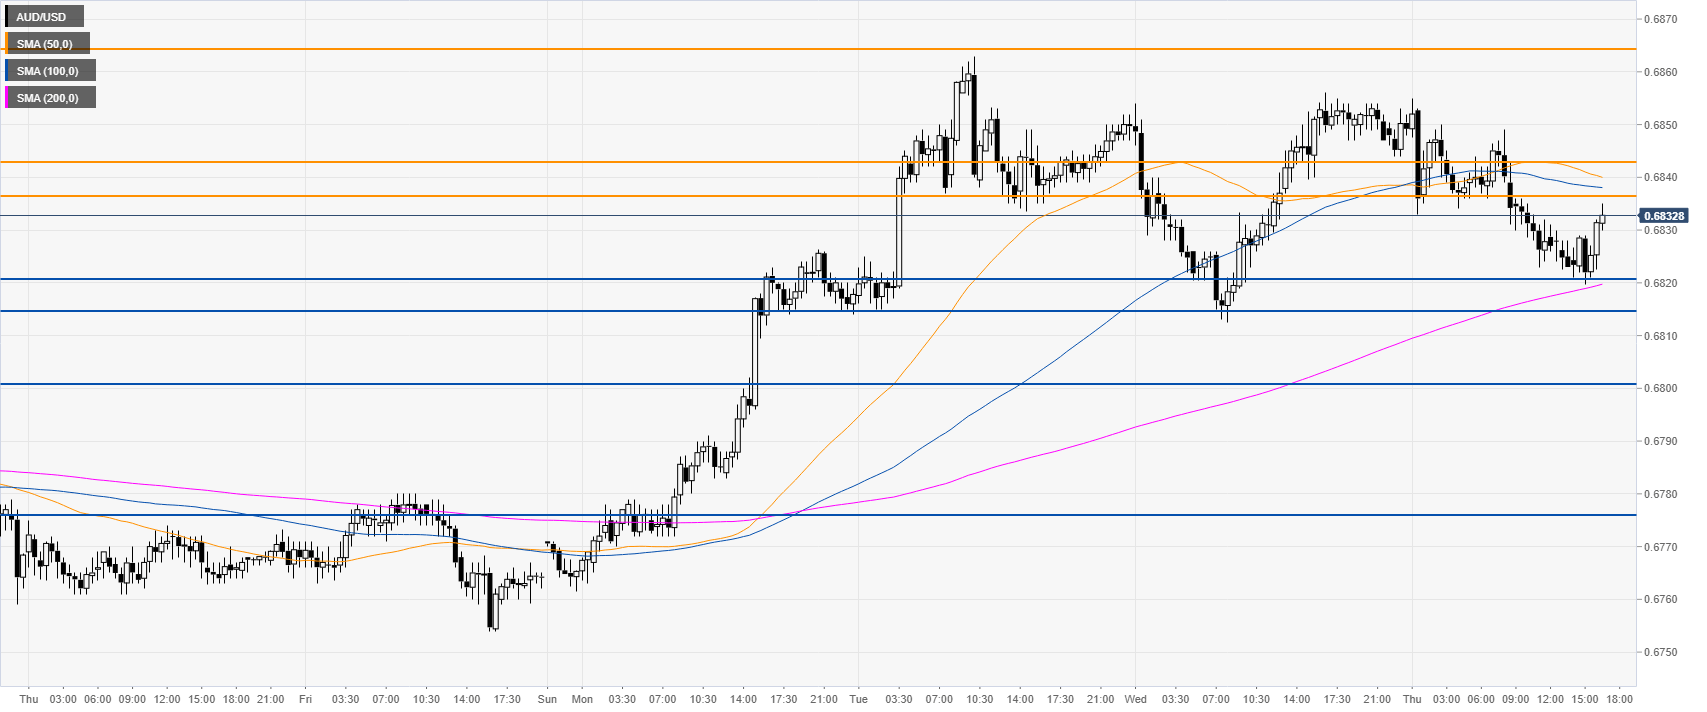
AUD/USD 30-minute chart
AUD/USD is off the daily lows while trading above the 200 SMA but below the 50/100 SMAs, suggesting a consolidation in the near. As the underlying trend remains bearish, the sellers could try to break the 0.6821/14 support zone. Further down lie the 0.6800, 0.6779 and 0.6775 level.

Additional key levels
