Back
2 Jan 2020
GBP/USD Technical Analysis: Sellers lurk around 61.8% Fibonacci amid overbought RSI
- GBP/USD stays mildly bid below near-term key resistance, above 200-bar SMA.
- Overbought RSI conditions, repeated failures to clear the upside barrier indicate a pullback.
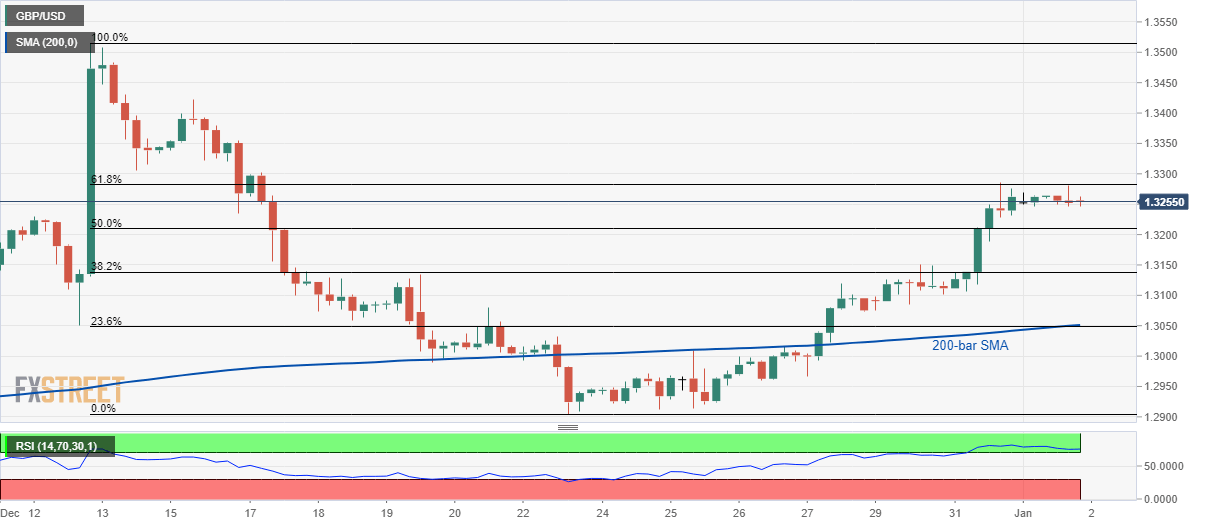
GBP/USD trades modestly changed to 1.3255 during the Asian session on Thursday. The pair stays below 61.8% Fibonacci retracement of its December 12-23 fall amid overbought conditions of the 14-bar RSI.
As a result, chances are high for the pair’s pullback towards 50% and 38.2% Fibonacci retracement levels of 1.3210 and then towards 1.3135 respectively.
However, a confluence of 200-bar SMA and 23.6% Fibonacci retracement near 1.3050 will restrict the pair’s further declines.
Meanwhile, pair’s sustained break above 61.8% Fibonacci retracement, at 1.3282, can challenge December 16 high of 1.3423.
During the quote’s run-up beyond 1.3423, the yearly top surrounding 1.3515 will be the Bull’s choice.
GBP/USD four-hour chart
Trend: Pullback expected