USD/MXN Price Analysis: Mexican Peso searches for firm direction near short-term key levels
- USD/MXN bears catch a pause after a two-day losing streak.
- A confluence of 21-day SMA and 23.6% Fibonacci retracement restrict immediate downside.
- Buyers can aim for Friday’s top ahead of March peak and them monthly high.
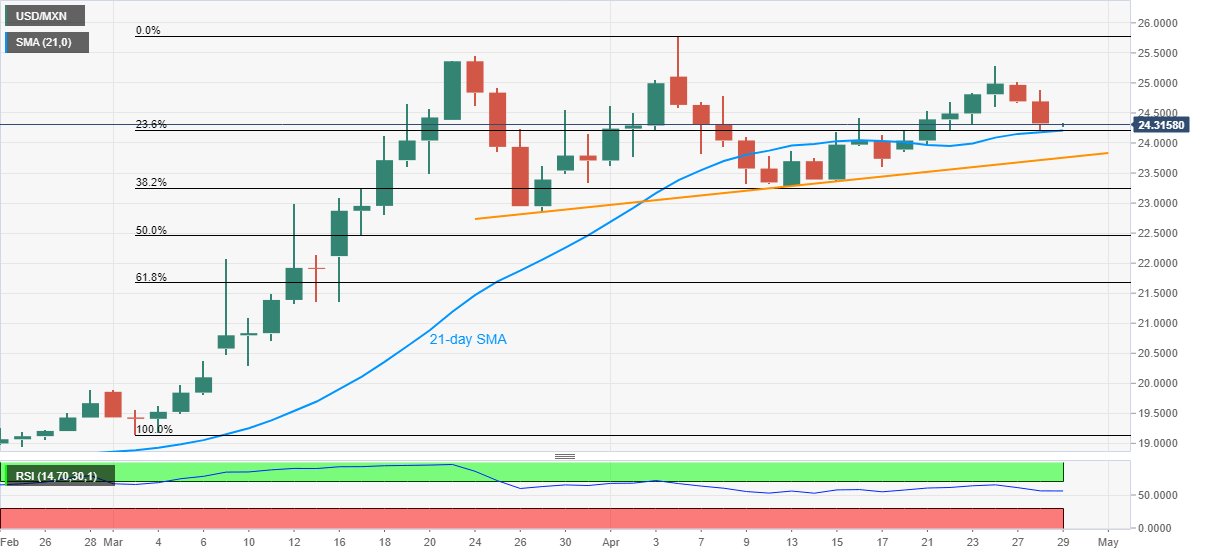
USD/MXN registers gradual recoveries from 24.21 to currently around 24.33 following its two-day drop during the early Asian session on Wednesday.
While a confluence of 21-day SMA and 23.6% Fibonacci retracement of March-April upside could be cited as a reason for the pair’s latest pullback, its declines after Friday’s spinning top keeps the bears hopeful.
As a result, the USD/MXN traders are looking for a firm direction amid normal RSI conditions.
In doing so, a sustained break below 24.20 signals the pair’s further declines to a month-old support line near 23.75 whereas 25.00 and March month high near 25.45 limits near-term upside.
It’s worth mentioning that the pair’s successful break above 25.45 enables it to cross the monthly high, also the record top, surrounding 25.80 while targeting 26.00 round-figure.
USD/MXN daily chart
Trend: Sideways