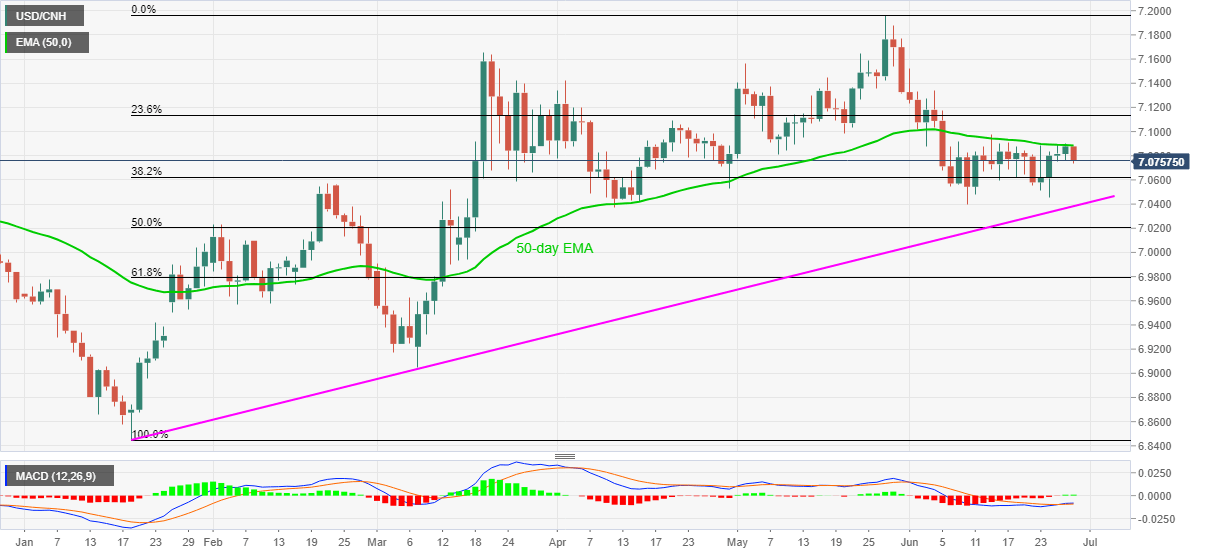
USD/CNH Price Analysis: Another pullback from 50-day EMA highlights multi-day-old support line
- USD/CNH pair’s bounce off 7.0734 fails to defy the early-day fall from 7.0880.
- Monthly bottom, April month’s low offer additional support.
- Multiple resistances around 7.1425/30 might could check the bulls past-50-day EMA.
USD/CNH prints 0.18% losses while declining 7.0755 during the early Monday. In doing so, the pair repeats its pullback moves from 50-day EMA to register the largest losses in a week after the bourses in China re-opened post-holidays.
The pair currently drops towards 38.2% Fibonacci retracement level of January-May upside, near 7.0620. However, major attention will be given to an upward sloping trend line from January 20, at 7.0380 now.
Also likely to challenge the bears will be the current month’s low and the April month trough, respectively around 7.0400 and 7.0370 respectively.
On the flip side, a daily close beyond 50-day EMA level of 7.0885 could confront 23.6% Fibonacci retracement level near 7.1135. Though, multiple levels marked between the late-March and May could question the pair’s further upside around 7.1425/30 afterward.
In a case where the bulls dominate past-7.1430, March month high close to 7.1655 and the yearly top surrounding 7.1965 could regain market attention.
USD/CNH daily chart

Trend: Pullback expected
