Gold Price Analysis: XAU/USD pierces $1,800 inside short-term bullish flag
- Gold prices extend recoveries from $1,798.14, defies two-day losing streak.
- A seven-day-old bullish technical pattern, sustained trading beyond immediate support favor the buyers.
- 200-HMA offers additional downside support, bulls will cheer break of $1,811.60.
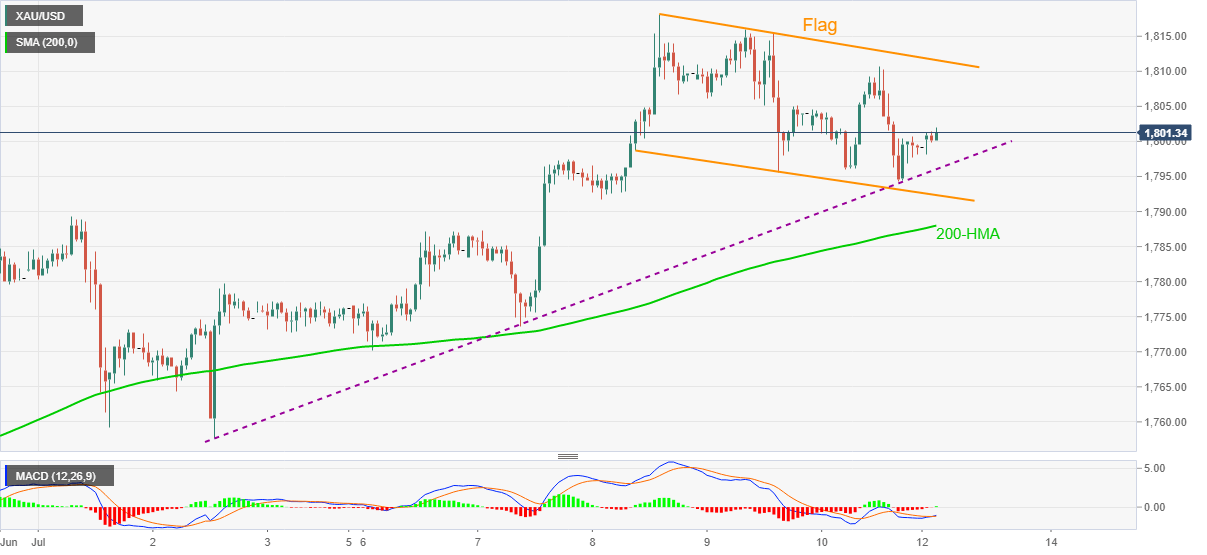
Gold prices print mild gains of 0.12% while taking the bids near $1,801.30 during the initial hour of Tokyo open on Monday. The yellow metal portrays a bullish flag on the hourly chart while keeping its trading momentum beyond a seven-day-old support line and 200-HMA.
Considering the bullion’s repeated bounces off near-term key supports, coupled with the MACD conditions, buyers may aim for $1,805 as an immediate resistance ahead of confirming its further run-up. In doing so, $1,811.60 holds the key to challenging the recent high, also the highest since late-2011, around $1,818.20.
It’s worth mentioning that the late-August 2011 tops near $1,840 might offer intermediate halts during the precious metal’s rise to the record high above $1921.
Alternatively, an upward sloping trend line from July 02, at $1,795.90 now, can become immediate support ahead of the said flag’s lower line near $1,792.30.
If at all the sellers defy the bullish formation, a 200-HMA level of $1,788 will validate the quote’s further weakness.
Gold hourly chart
Trend: Bullish