WTI Price Analysis: Bearish spinning top below 200-day SMA keeps sellers hopeful under $43.00
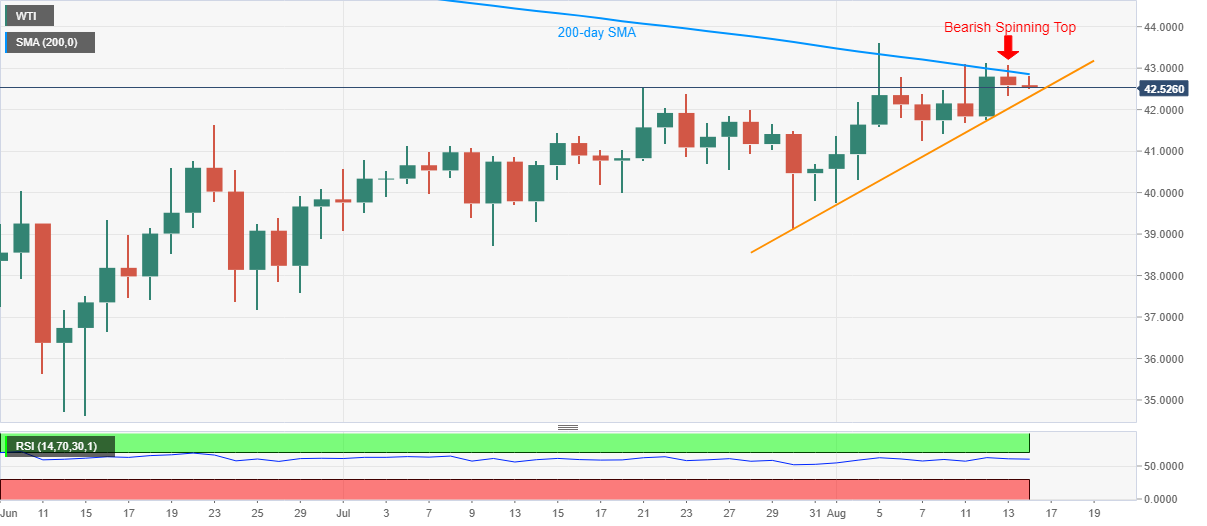
- WTI seesaws near intraday low of $42.50 after marking fifth failure to cross 200-day SMA.
- Bearish candlestick formation highlights a two-week-old support line.
- The monthly high, $44.00 add to the upside barriers.
WTI remains pressured near $42.50, currently down 0.15% on a day, during the early Friday. The energy benchmark extends the previous day’s downbeat performance after flashing another U-turn from the key SMA level.
In doing so, the resulted bearish candlestick directs sellers towards an ascending trend line from July 30, at $42.30.
However, the black gold’s further downside becomes doubtful amid upbeat RSI conditions, which if ignored could propel the south-run towards $40.80 and the monthly low near $39.75.
Alternatively, the commodity’s sustained break of 200-day SMA, $42.85, will have to refresh the monthly high of $43.62 before targeting the February month peak surrounding $44.00.
If at all the bulls remain dominant past-$44.00, March month’s high of $48.74 will be in the spotlight.
WTI daily chart
Trend: Pullback expected