USD/INR Price News: Indian rupee bulls dominate inside five-week-old falling wedge
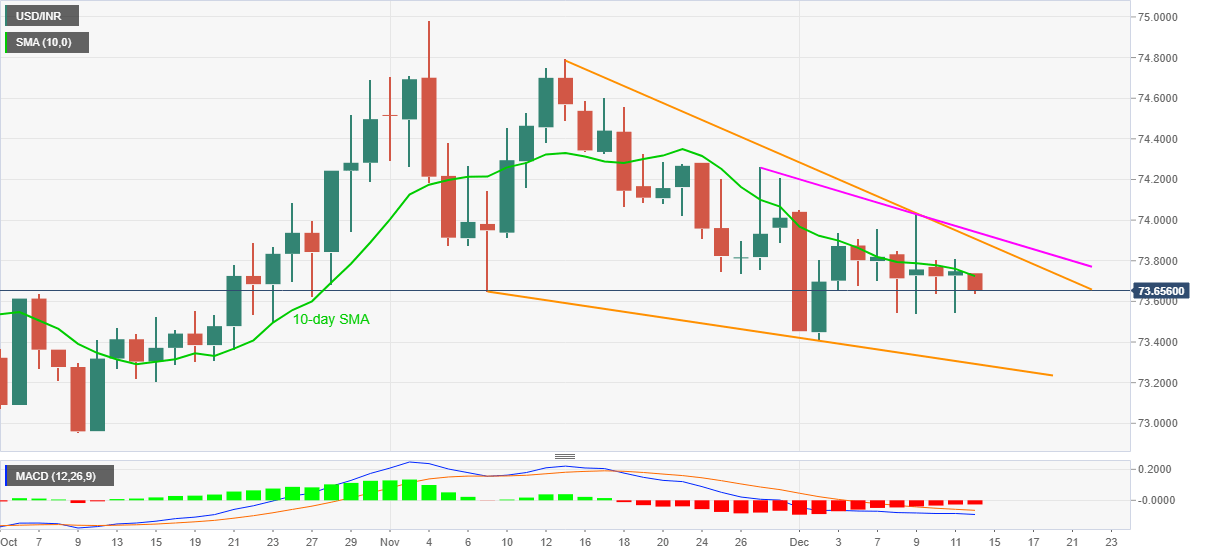
- USD/INR stays mildly offered below 10-day SMA, inside a bullish chart pattern.
- Short-term falling trend line adds filters to the upside.
- Bears eyeing October lows have multiple barriers to conquer.
USD/INR struggles to fill the downside gap on the week’s start ahead of Monday’s Indian session. The quote began the week around 73.65, down from 73.74, before recently bouncing off 73.64.
Even so, USD/INR sellers dominate below 10-day SMA while eyeing a re-test of the last Wednesday’s low near 73.54.
Though, the pair’s declines past-73.54 will attack the support line of the stated bullish formation, at 73.29 now, before targeting October’s low near 72.95.
Meanwhile, an upside clearance of 10-day SMA, at 73.72 now, will seek to confirm the bullish play by highlighting the falling trend line from November 13, currently around 73.90.
Also acting as the key resistance is a resistance line stretched from November 27, near 73.95, which holds the key to the pair’s run-up towards November 13 high near 74.80.
USD/INR daily chart
Trend: Pullback expected