Silver Price Analysis: XAG/USD stays above 100-day SMA despite recent pullback
- Silver refreshes intraday low following a pullback from $26.58.
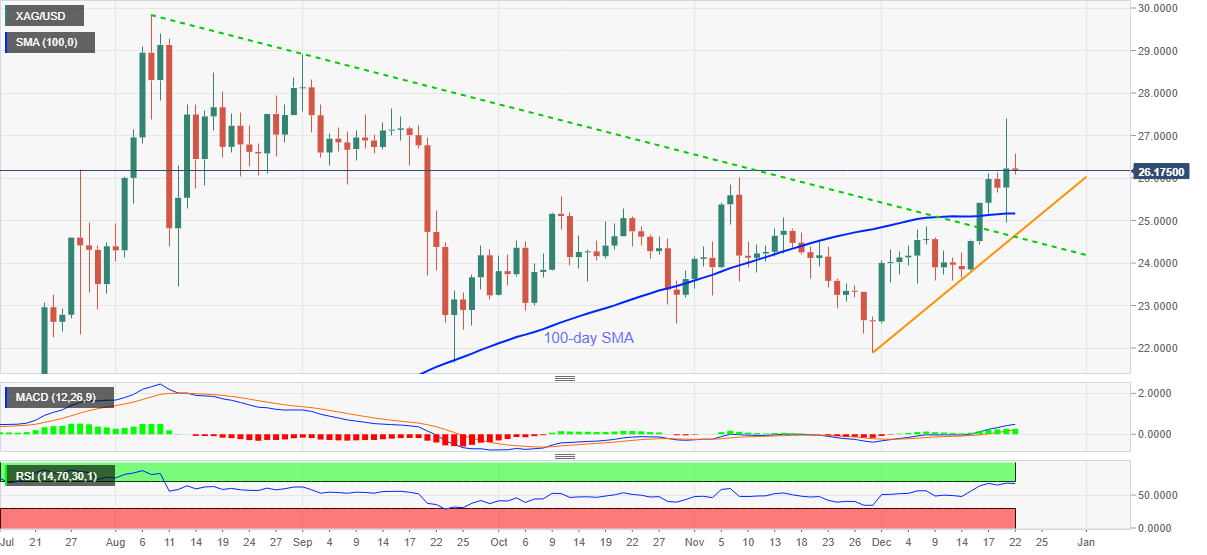
- Sustained break of medium-term resistance line, 100-day SMA favor buyers.
- Monthly support line adds to the downside filters.
Silver declines to $26.09, down 0.33% intraday, during the pre-European trading on Tuesday. Even so, the white metal remains above 100-day SMA amid bullish MACD.
As a result, silver bulls are geared towards the mid-September highs, near $27.60, with the previous day’s top near $27.40 acting as an immediate upside barrier.
While RSI conditions may challenge the bullion buyer beyond $27.60, highs marked in September and August, respectively around $28.90 and $29.85, will add to the upside filters ahead of the $30.00 threshold.
On the contrary, a downside break below the 100-day SMA level of $25.16 needs to slip beneath the confluence of a downward sloping trend line from early August as well as an ascending support line from November 30, around $24.60.
It should, however, be noted that a daily closing below $24.60 will not refrain from challenging the November lows surrounding $21.90.
Silver daily chart
Trend: Bullish