Back
12 Feb 2021
USD/CAD Price Analysis: Trades above 1.27, looks north
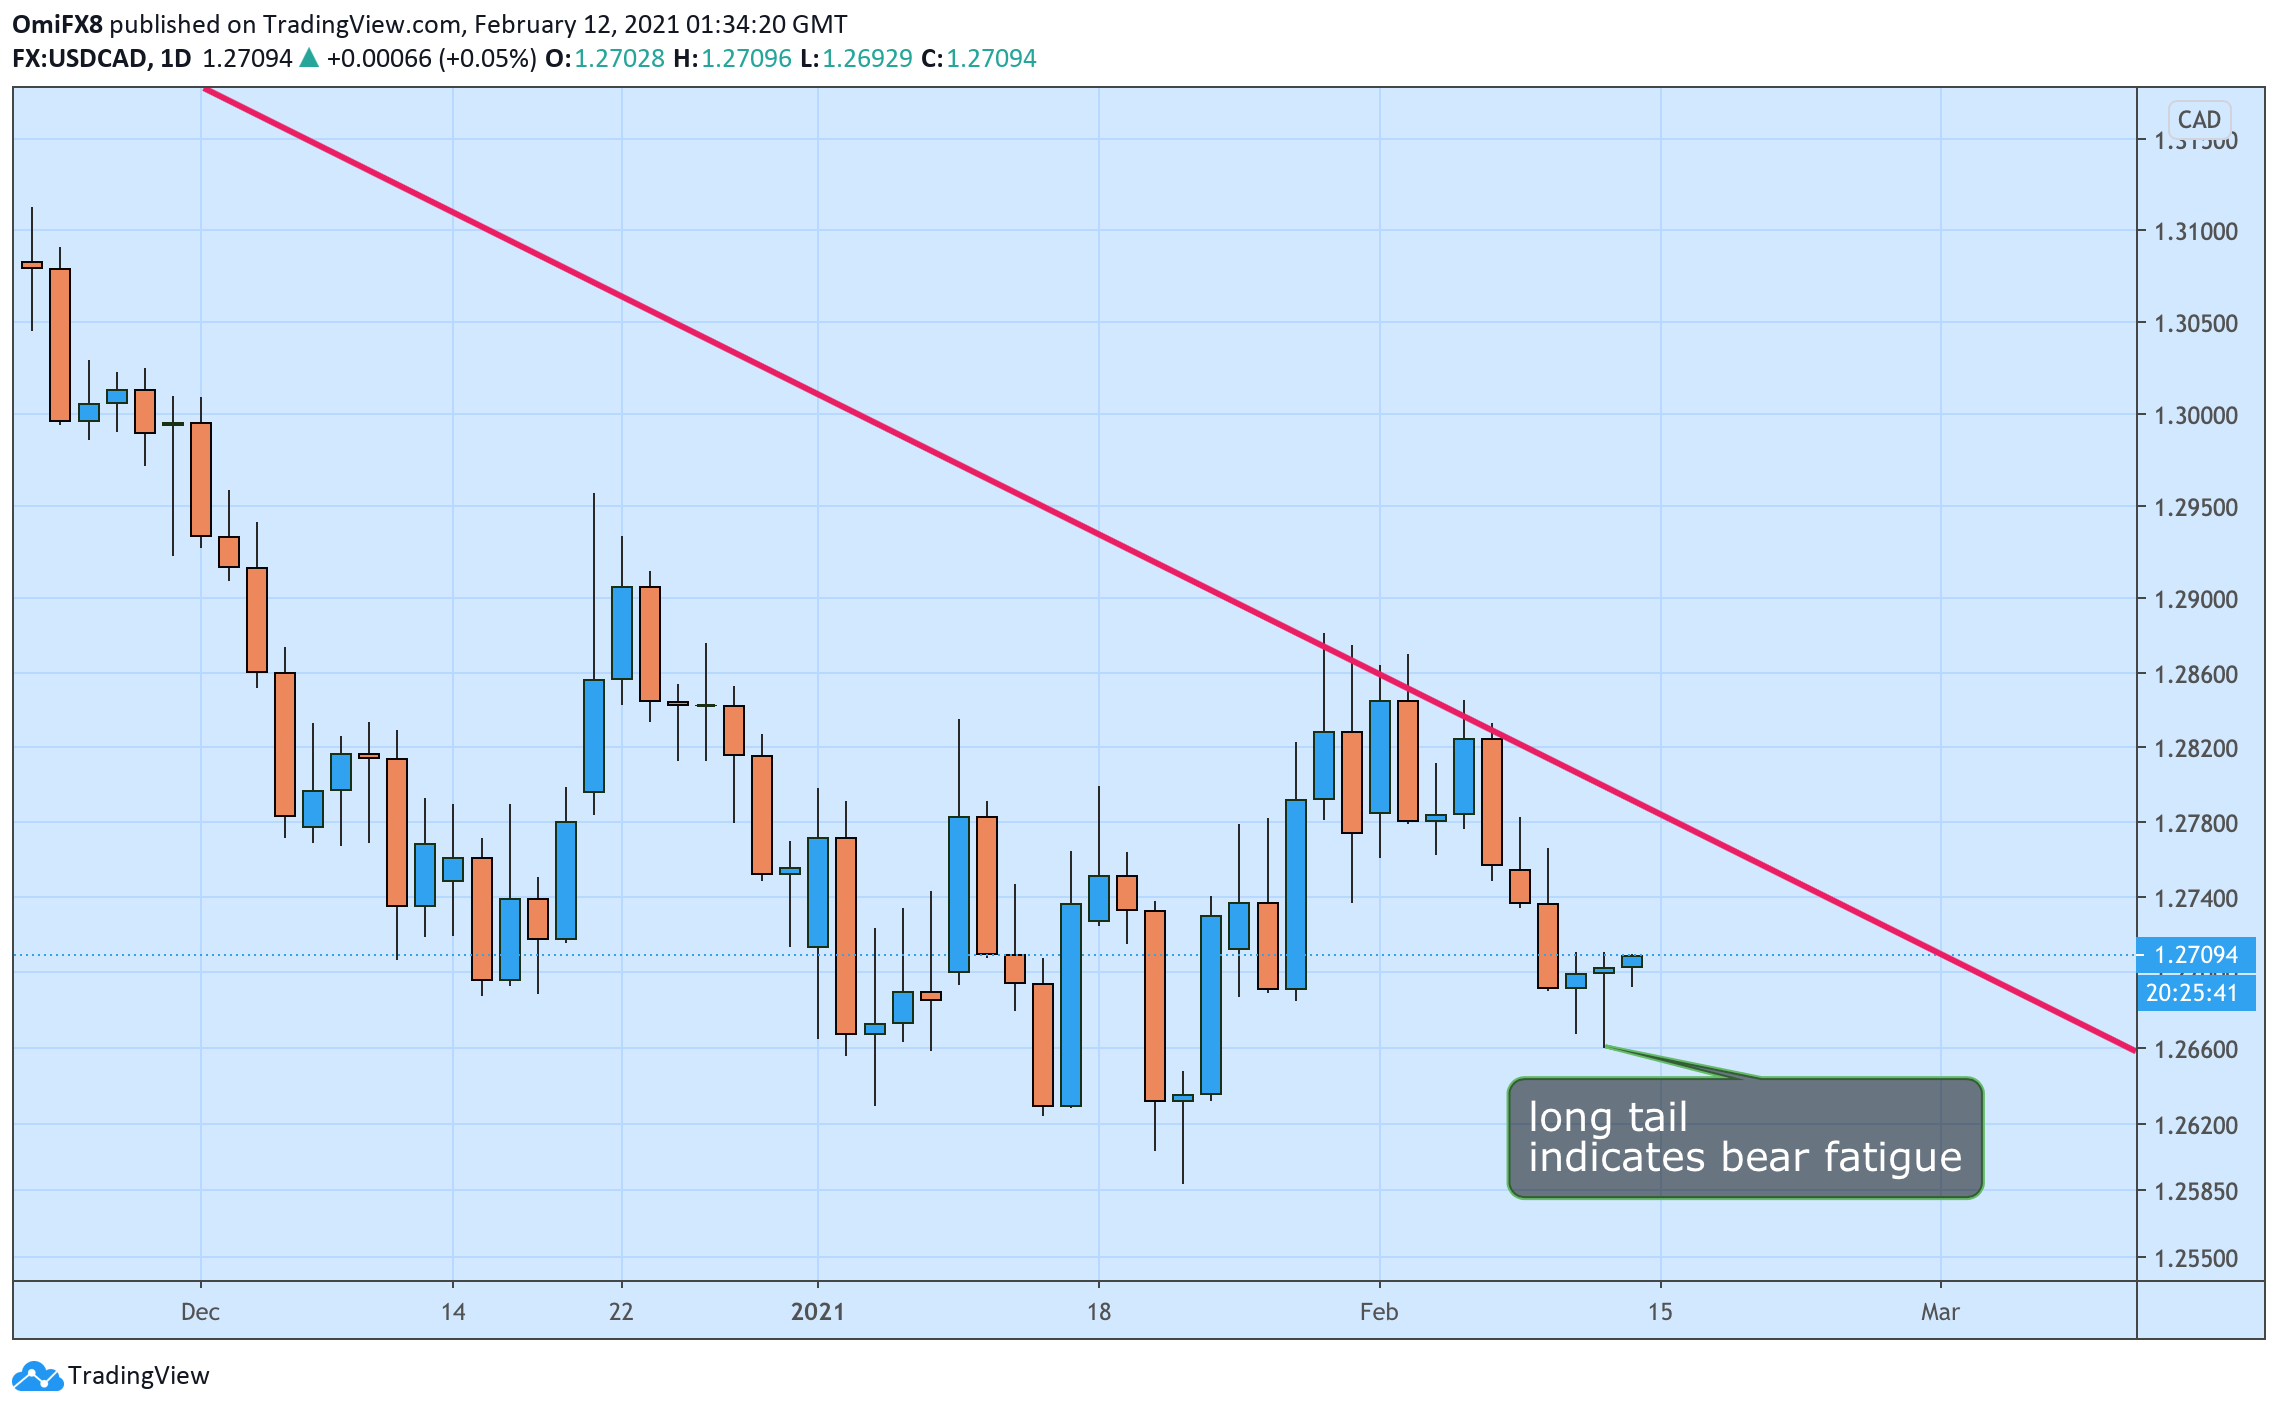
- USD/CAD's daily chart show dip demand below 1.27.
- The 4-hour chart MACD and RSI are biased bullish.
USD/CAD is currently trading mostly unchanged on the day near 1.2707, having hit a low of 1.2693 early Friday.
The long-tails attached to the previous two daily candles indicate bear figure/bear failure below 1.27.
The 4-hour chart MACD histogram, an indicator to gauge trend strength and trend changes, has crossed into bullish territory above zero. Meanwhile, the 4-hour chart Relative Strength Index has violated the descending trendline.
As such, the pair looks set to the 50-day Simple Moving Average hurdle, currently at 1.2755.
Daily chart

Trend: Bullish
Technical levels
