WTI bears take control at the start of the week, bucking the trend
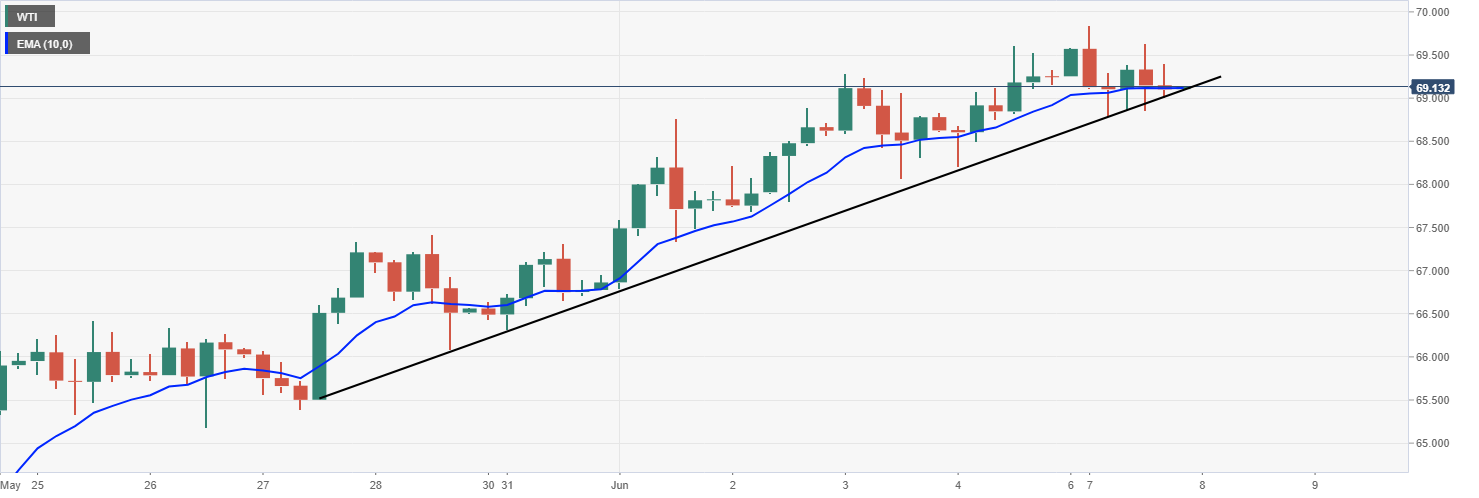
- WTI drifts back to the dynamic trendline support on the 4-hour time frame.
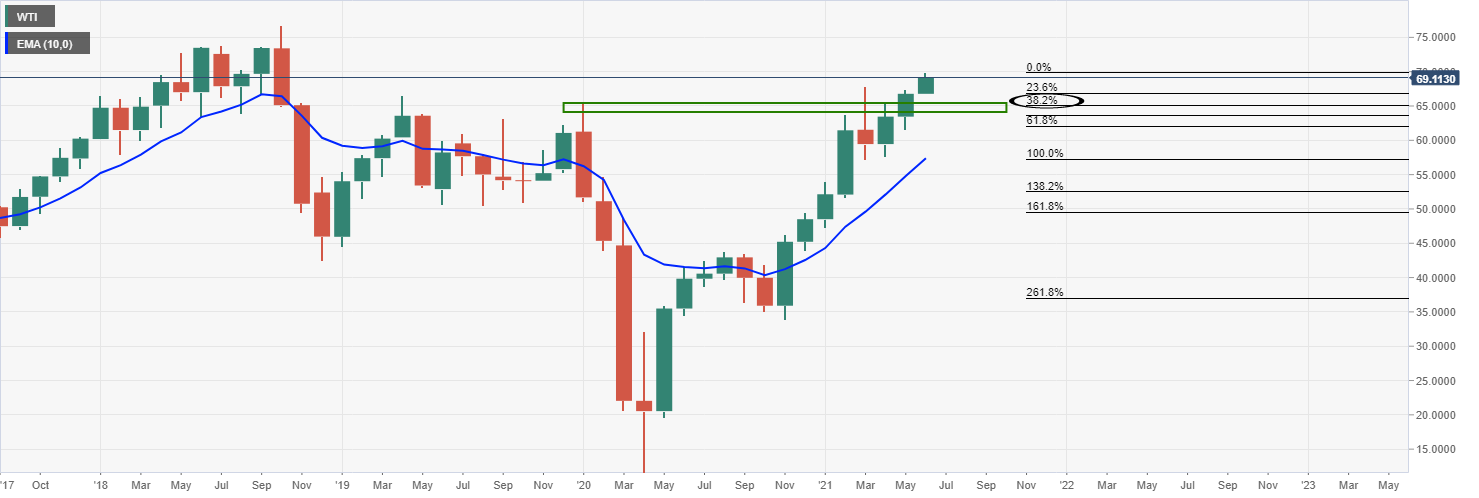
- The monthly chart is reaching into resistance and a correction could be on the cards.
The price of oil continues to consolidate the daily bullish trend and on Monday, the price has melted to the 4-hour dynamic support. At the time of writing, WTI is down 0.26% into the close on Wall Street. The rice fell from a high of $69.97 to a low of $68.95.
Chinese data showed crude oil imports fell to a year's low in May and likely played into the fragility of oil prices following a fun to two-year highs the prior work.
Crude has risen for two weeks, with Brent up by 38% this year and WTI rising 43% on the expectations of improved demand and the Organization of the Petroleum Exporting Countries and ally producers keeping supply curbs in place has otherwise been a lift for the market.
Meanwhile, on Monday, OPEC Secretary-General Mohammad Barkindo said OPEC+ expects inventories to fall further in coming months.
All in all, increased global demand is anticipated following decisions by the United States and Europe to loosen COVID-19 restrictions.
Additionally, India has begun to ease its latest lockdown.
''A global vaccination rollout is set to drive mobility sharply higher this summer, in response to massive pent-up demand,'' analysts at TD Securities explained.
''Ultimately, the global market will be able to absorb the additional barrels, and strong summer demand could translate into higher prices before OPEC+ increases the flow of spare capacity returning to market.
This suggests that a break north of $70/bbl may prove unsustainable, given the massive scale of spare capacity, but the set-up for a summer breakout continues to firm. CTAs remain well-positioned for further upside.''
WTI technical analysis
Technically, the 4-hour 10-EMA keeps the price supported on Monday as it rides the dynamic trendline.
However, according to the monthly chart, a correction might be on the cards before long. The prior weekly highs have a confluence with the 38.2% Fibonacci retracement level at 65.611 at this point.