Gold Price Forecast: XAU/USD could extend correction with a daily close below $1,820
- XAU/USD is edging lower following last week's rally.
- Gold could extend correction to $1,810 with a daily close below $1,820.
- There won't be any high-tier data releases featured in US economic docket on Tuesday.
Gold spent the majority of the previous week moving sideways in a tight range above $1,800 but managed to gain traction following the disappointing August jobs report from the US on Friday. After posting its highest weekly close since late July at $1,827, however, the XAU/USD pair reversed its direction on Monday and was last seen losing 0.3% on a daily basis at $1,822.
In the absence of significant fundamental drivers, gold's action seems to be a technical correction of last Friday's upsurge. Additionally, trading conditions remain thin due to the Labor Day holiday in the US, confirming the view that gold is staying in a consolidation phase rather than moving into a downtrend.
On Tuesday, there won't be any high-tier macroeconomic data releases from the US and the risk perception could impact the greenback's valuation and XAU/USD's movements.
The data published by the US Bureau of Labor Statistics revealed on Friday that Nonfarm Payrolls (NFP) rose by 235,000 in August. This print missed the market expectation of 750,000 by a wide margin and the S&P 500 Index closed the day flat. In case Wall Street's main indexes turn south following the long weekend, the greenback could find demand as a safe haven and force XAU/USD to remain on the back foot.
On the other hand, the dismal NFP reading is also seen as a factor that could allow the Federal Reserve to delay asset tapering. A dovish policy outlook is likely to limit the USD's gains in the near term.
Meanwhile, the trading activity in gold futures points to additional gains. "Open interest in gold futures markets rose by nearly 9K contracts on Friday and reversed two consecutive daily pullbacks considering flash data from CME Group," said FXStreet Lead European Editor Pablo Piovano. "In the same line, volume went up by almost 75K contracts, also following two daily drops in a row."
Gold technical outlook
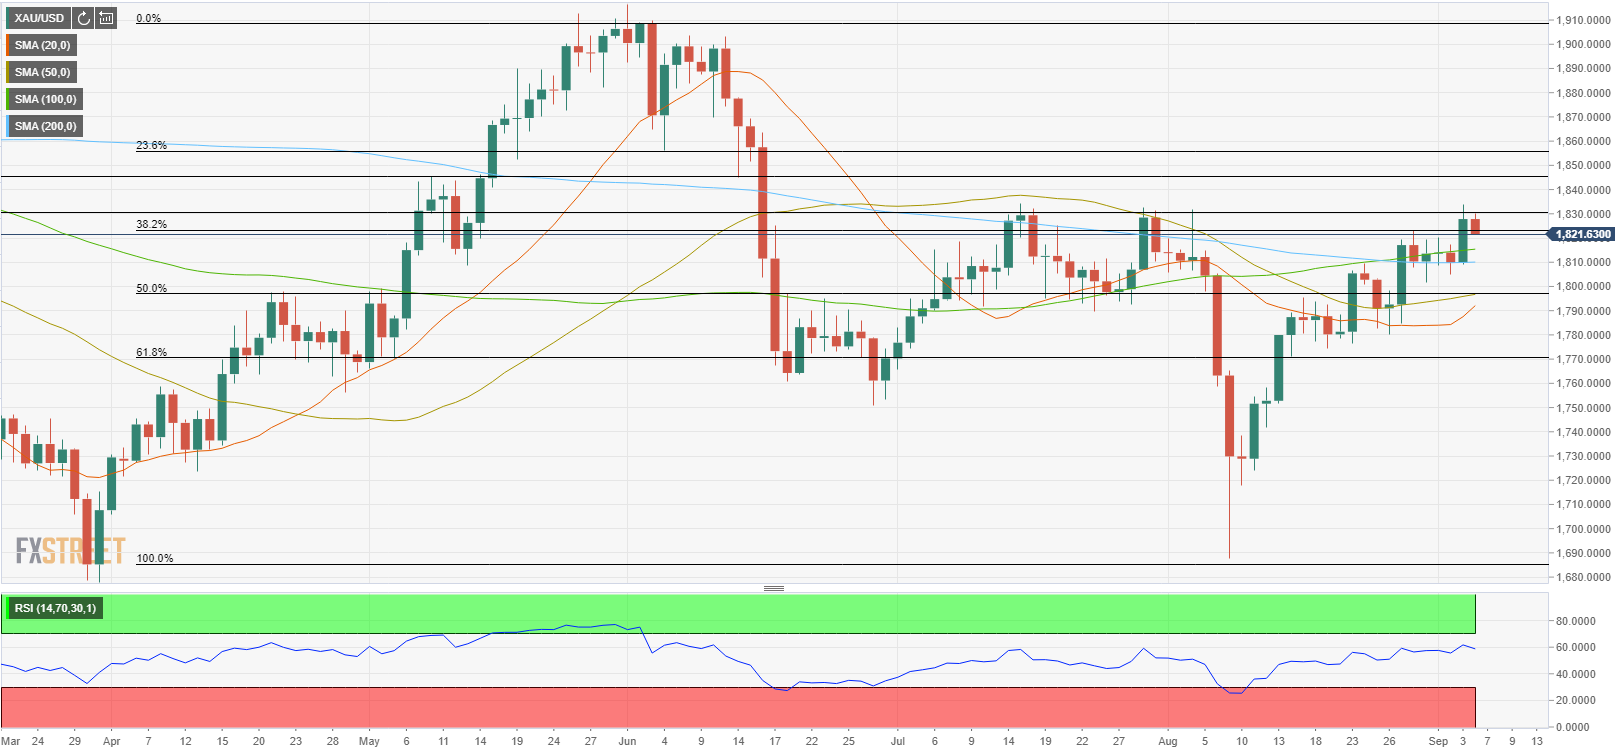
On the downside, the initial support is located at $1,820 (Fibonacci 38.2% retracement of April-June uptrend). With a daily close below that level, gold could extend its slide toward $1,810 (200-day SMA). In case this level turns into resistance, the next target is located at $1,800 (psychological level).
Resistances could be seen at $1,830 (static level), $1,845 (static level) and $1,855 (Fibonacci 23.6% retracement).
Additional levels to watch for