USD/RUB Price Analysis: Prints a YTD high at 117.68 though RSI’s negative divergence in the H1 chart looms
- The USD/RUB depreciated 44% in the last two days, spurred by the Russia – Ukraine conflict.
- On Tuesday, the USD/RUB prints a YTD high at 118.09.
- USD/RUB Technical Outlook: It is upward biased, though a negative divergence in the 1-hour chart looms, spurring an opportunity to dip buyers.
The USD/RUB skyrockets for the second straight day, as geopolitical tensions between Russia – Ukraine do not subside, while the USD/RUB reached a YTD high at 118.09. At the time of writing, the USD/RUB is trading at 117.75.
From a technical perspective, it is easy to spot that the USD/RUB is upward biased. The daily moving averages are below the 78.00 mark, and the USD/RUB sits above February 28 daily high at 111.67.
Therefore, it is suggested to approach USD/RUB price action from the 1-hour chart due to the strong uptrend and volatility of the markets. Caution is warranted.
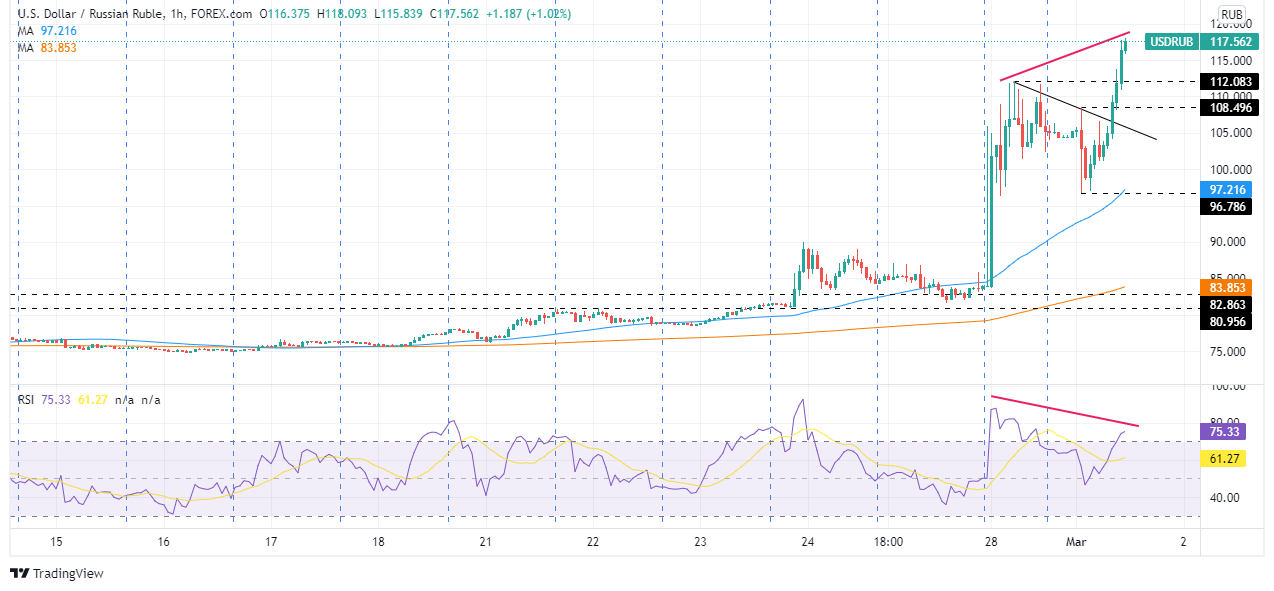
USD/RUB Price Forecast: Technical outlook
USD/RUB 1-hour chart shows that the USD/RUB depreciated 32% in the day on Monday. However, the pair traded in the 96.00-112.08, for some time, before breaking upwards, reaching a new YTD high at 116.76. However, the Relative Strength Index (RSI) is at overbought levels at 74.82, aiming higher, though if the USD/RUB stabilizes around the 112.08-116.76 range, it could print a new lower high, that could portray a negative divergence between price action and RSI. That said, it could spur a move downwards.
If that event plays out, USD/RUB first support would be 108.49. Breach of the latter would expose a downslope trendline, which passes around 105.00, followed by the confluence of the 50-hour simple moving average (SMA) and March 1 daily low at 96.78.