EUR/GBP Price Analysis: Probing the 2022 YTD highs above 0.8700
- The EUR/GBP extended its gains, despite the overall bearish bias in euro crosses.
- From a daily chart perspective, the EUR/GBP is headed upwards.
- Short term, the EUR/GBP 4-hour chart suggests the cross could drop before recording a fresh YTD high.
On Thursday, the EUR/GBP rallied for the second day in the week, registering a fresh weekly high at around 0.8720, spurred by overall British pound courtesy, amidst uncertainty around the new Prime Minister Liz Truss’s government. At the time of writing, the EUR/GBP is trading at 0.8717, unchanged as the Asian session begins.
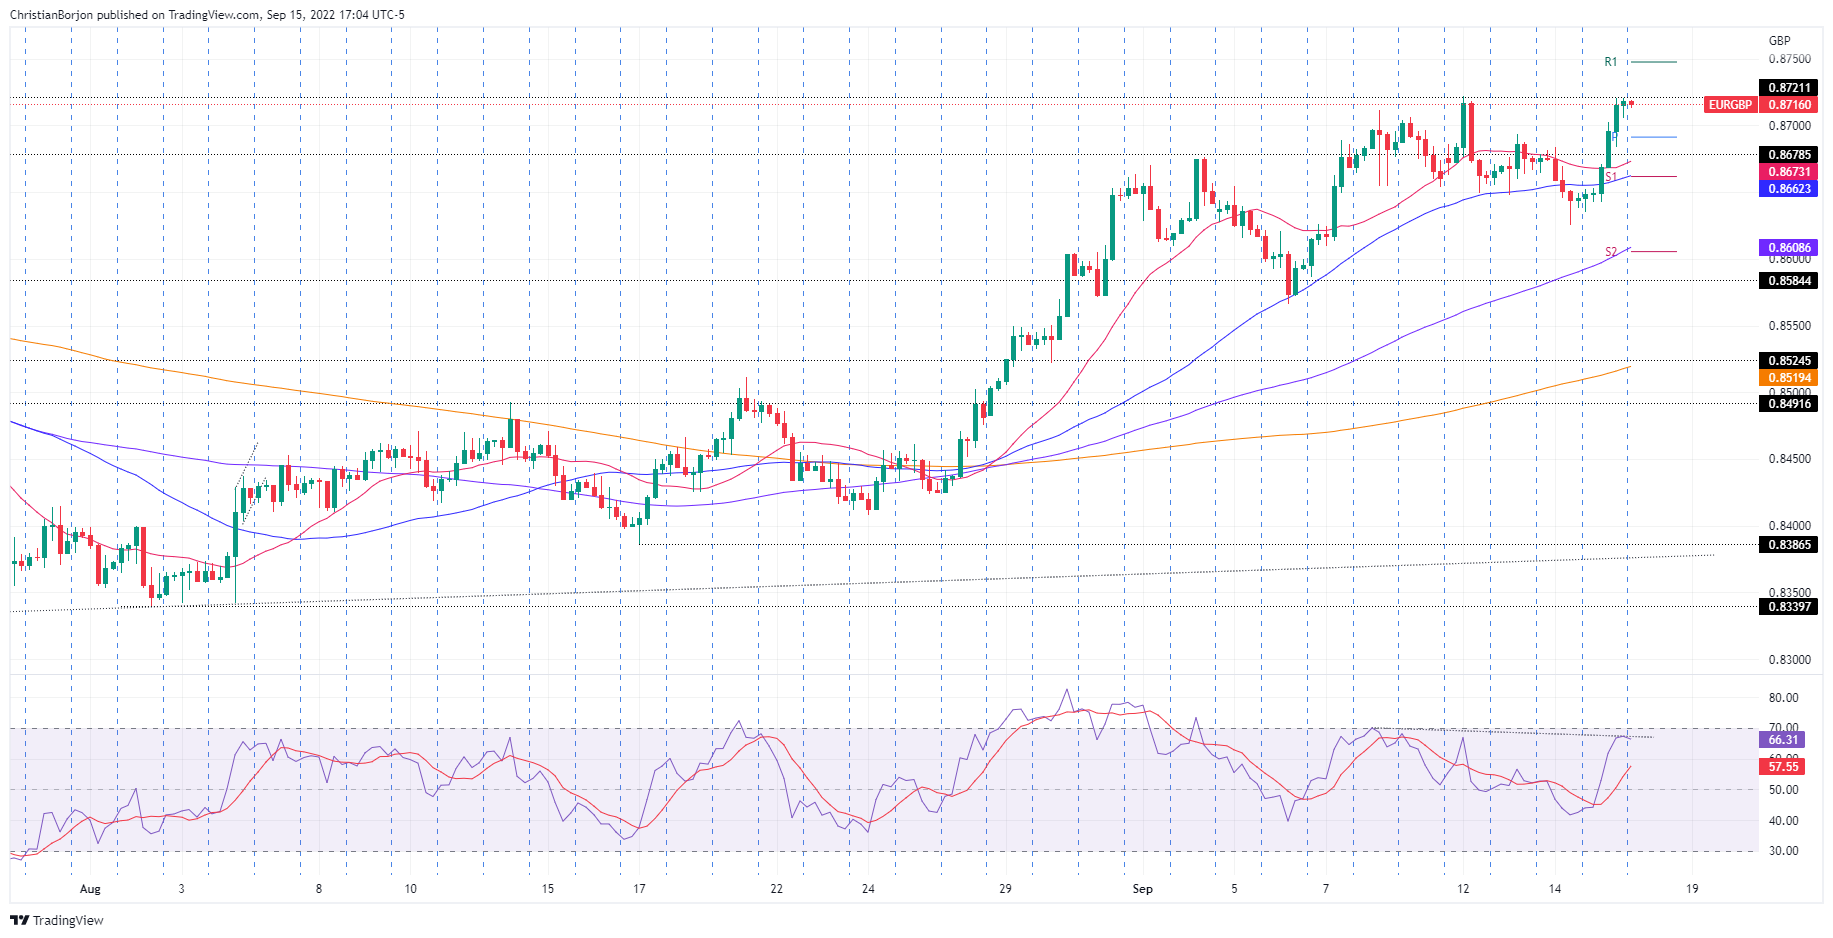
EUR/GBP Price Analysis: Technical outlook
The EUR/GBP advanced for the second day during the week, facing a solid resistance near the YTD high at 0.8721. The Relative Strength Index (RSI) is headed north but shifted flat around 66.93, with little room before reaching overbought conditions after last week’s ECB’s decision, ahead of the following week’s BoE. It’s worth noting that a decisive break above 0.8721 could pave the way towards the 0.8800 mark, but price action might shift choppy, in the vicinity of a 50 bps rate hike by the BoE.
The EUR/GBP 4-hour scale offers a different bias than the daily chart. Even though the moving averages (EMAs) are below the spot price, the divergence between the RSI, recording lower highs, and price action at higher highs might open the door for further downside.
Therefore, the EUR/GBP first support would be the 0.8700 mark, followed by the daily pivot at 0.8691, followed by the confluence of the 50-EMA and the S1 pivot point at 0.8660/62. Once cleared, the cross will tumble towards the confluence of the S2 pivot and the 100-EMA at around 0.8605/08.
EUR/GBP Key Technical Levels